Model Interpretation Report
| Interpretation result: |
|
| Problems: | 1 1 |
| Insights: | 0 |
| Model: |
{
  "model_type": "mock",
  "experiment_type": "binomial",
  "metadata": {
    "target_col": "SEX",
    "labels": [
      1
    ],
    "num_labels": 1,
    "used_features": [
      "ID",
      "LIMIT_BAL",
      "EDUCATION",
      "MARRIAGE",
      "AGE",
      "PAY_0",
      "PAY_2",
      "PAY_3",
      "PAY_4",
      "PAY_5",
      "PAY_6",
      "BILL_AMT1",
      "BILL_AMT2",
      "BILL_AMT3",
      "BILL_AMT4",
      "BILL_AMT5",
      "BILL_AMT6",
      "PAY_AMT1",
      "PAY_AMT2",
      "PAY_AMT3",
      "PAY_AMT4",
      "PAY_AMT5",
      "PAY_AMT6",
      "default payment next month"
    ],
    "transformed_features": [],
    "importances": {},
    "features_metadata": {
      "id": [],
      "categorical": [],
      "numeric": [],
      "catnum": [],
      "date": [],
      "time": [],
      "datetime": [],
      "text": [],
      "image": [],
      "date-format": [],
      "quantile-bin": {}
    },
    "model_path": ""
  }
}
|
| Target column: |
SEX
|
| Dataset: |
data/predictive/creditcard.csv
|
| Interpretation status: | SUCCESS |
| Interpretation ID: |
c2fbf2c1-0e39-43f5-a807-85f8c8af7e1c
|
| Created: |
2026-01-30 17:30:59
|
Explainers overview
Approximate model behavior
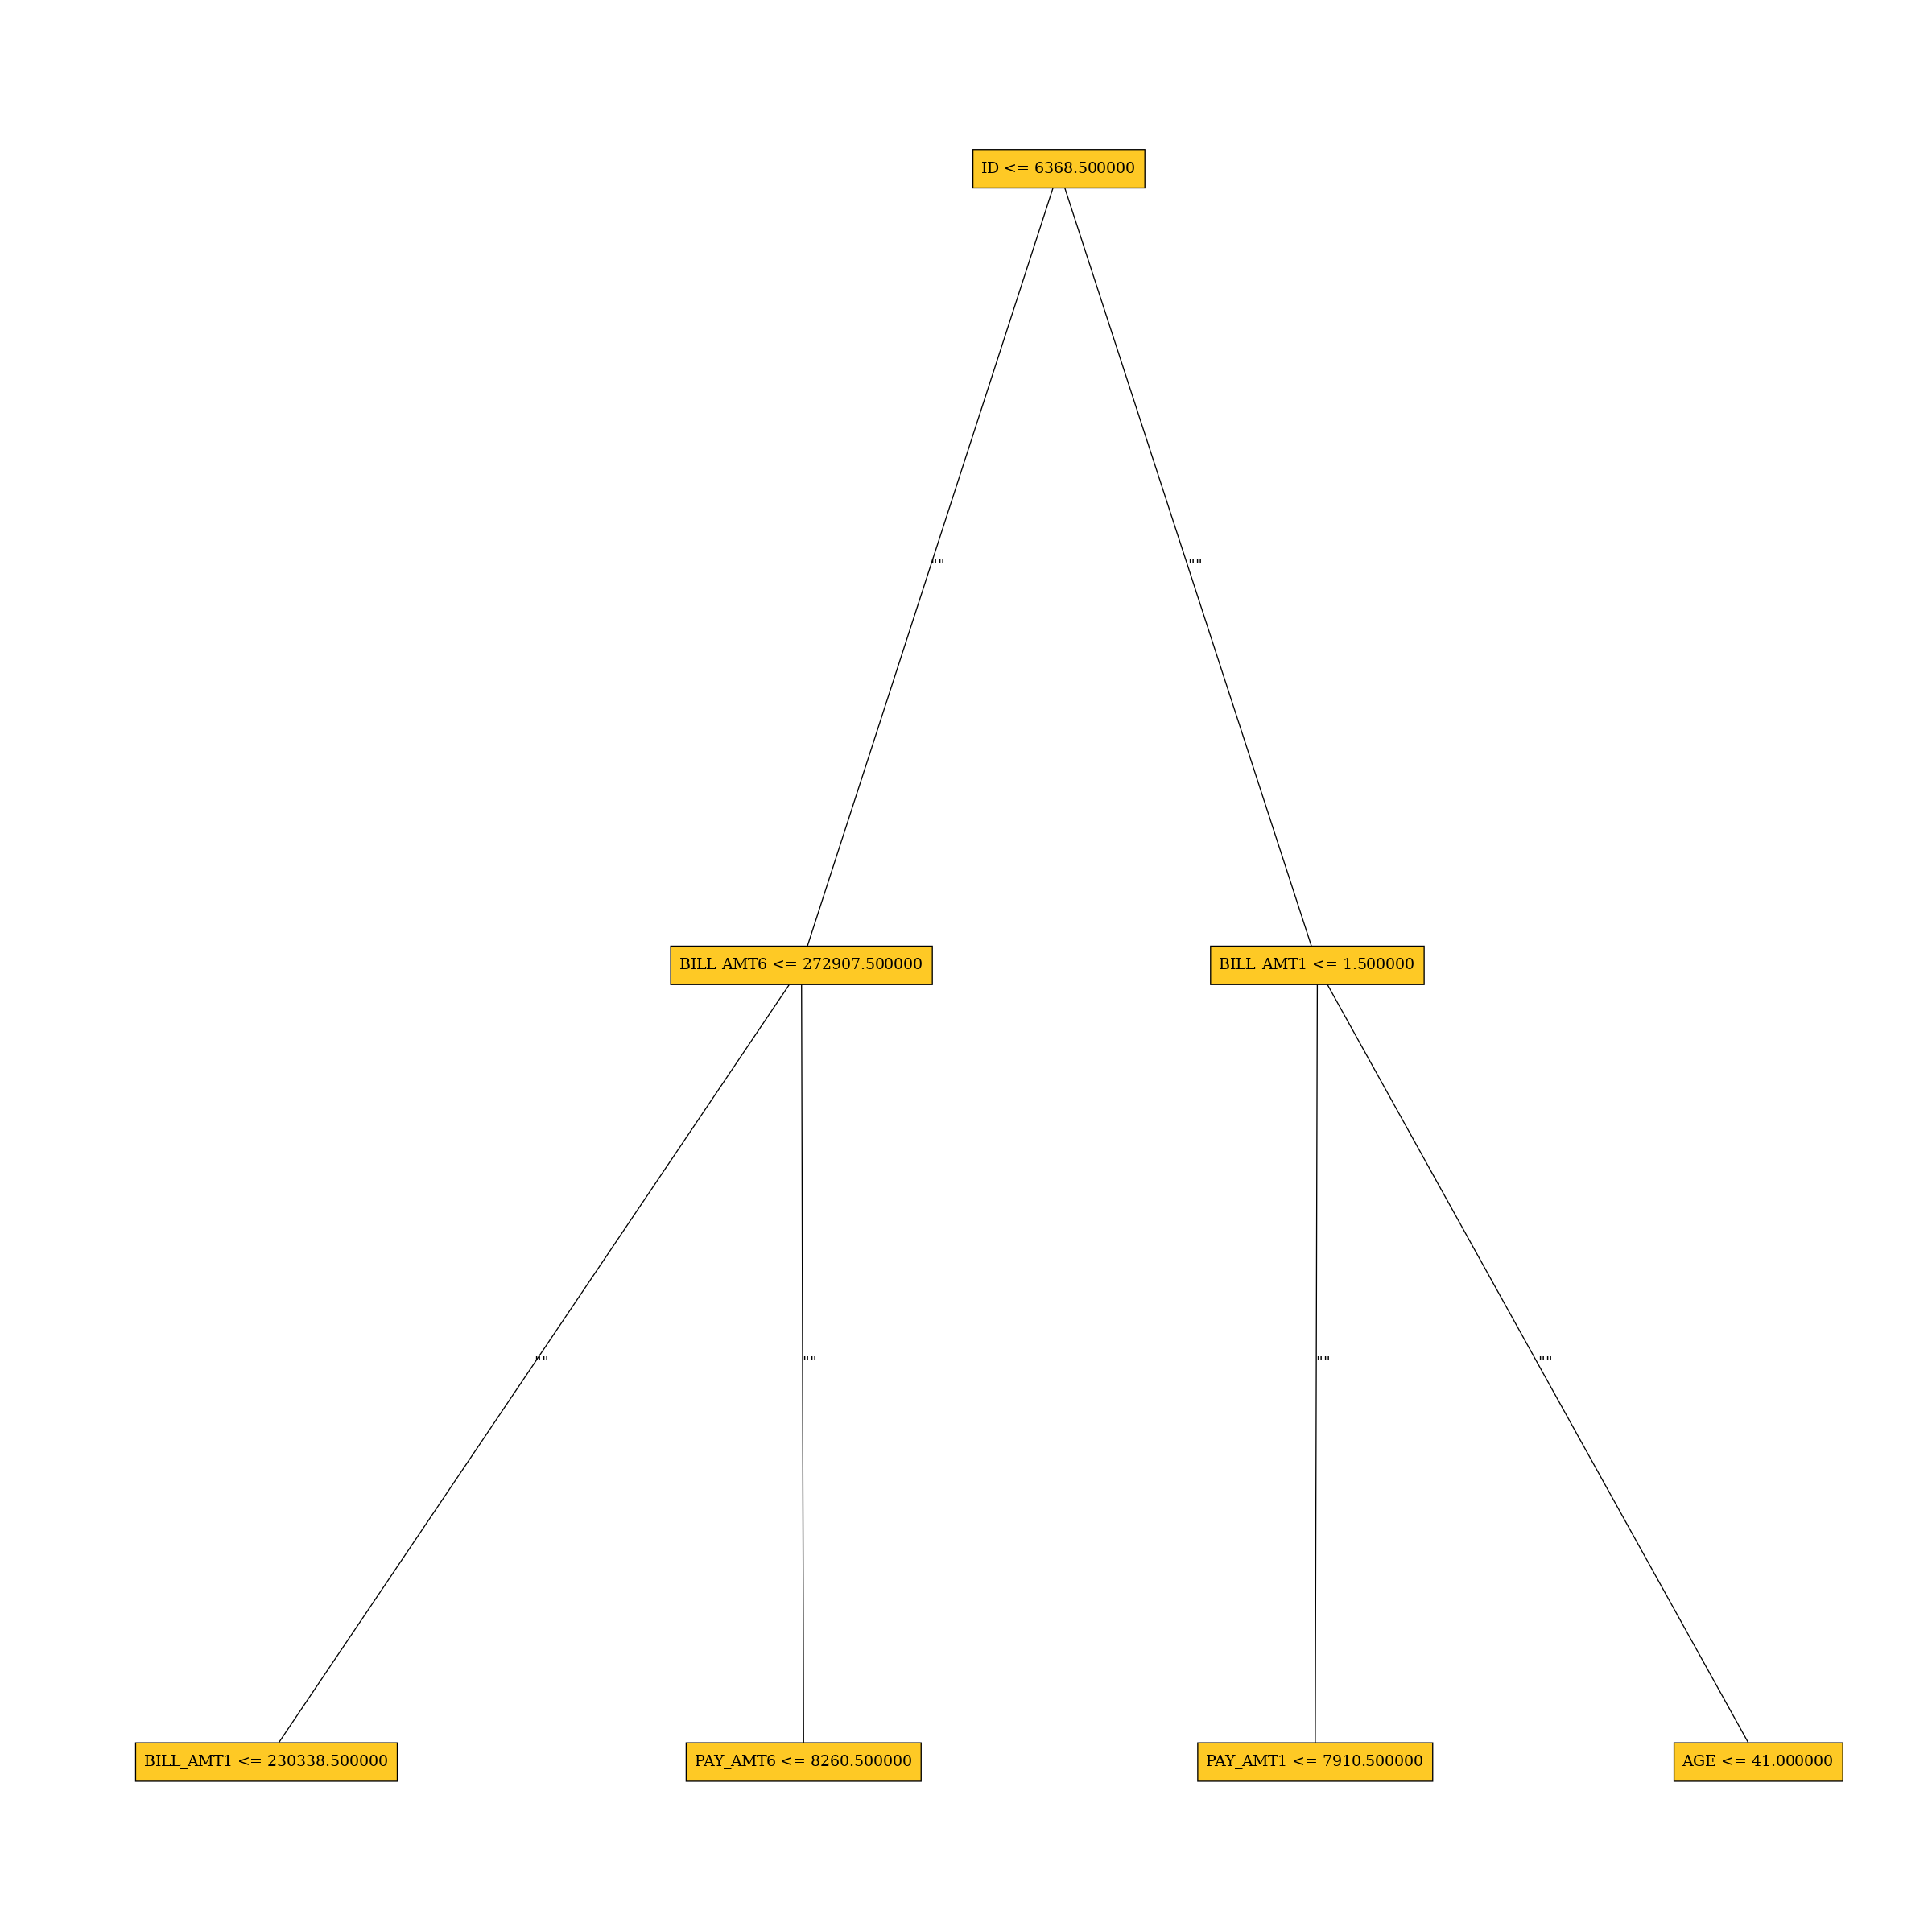
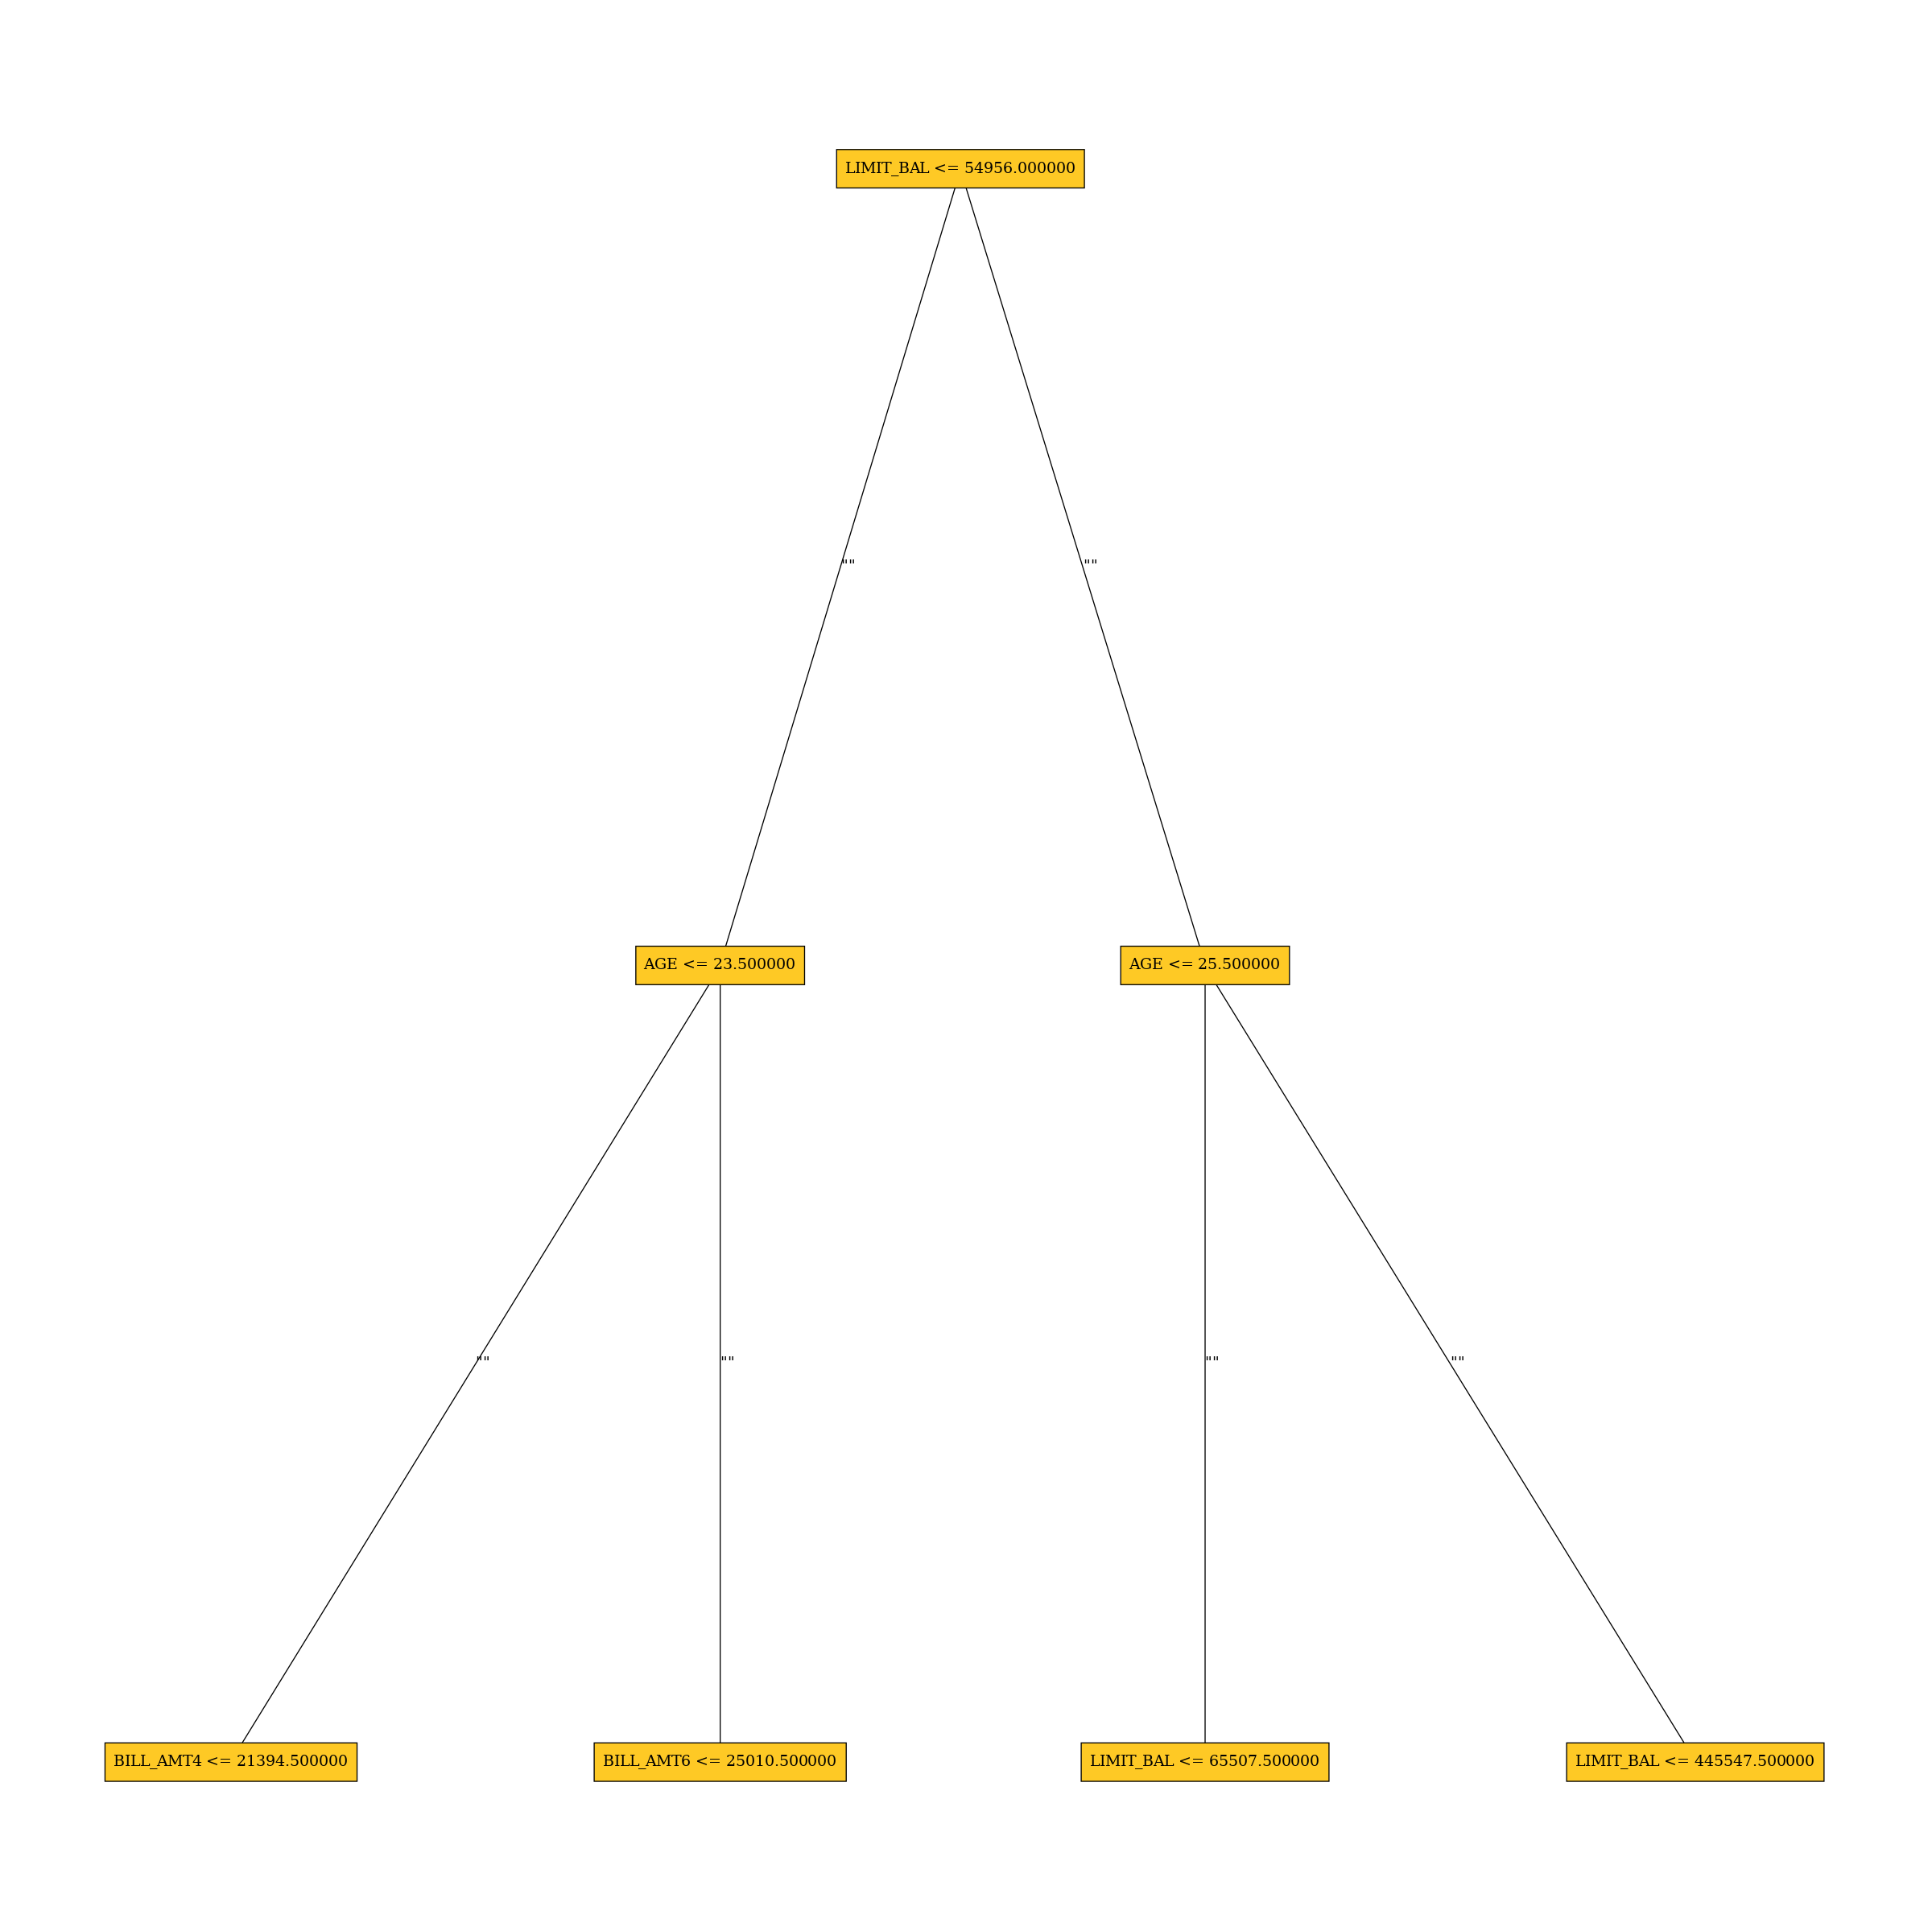
Surrogate Decision Tree
The surrogate decision tree is an approximate overall flow chart of the model, created by training a simple...
Original feature importance
Shapley Values for Original Features (Kernel SHAP Method)
Shapley explanations are a technique with credible theoretical support that presents consistent global and ...
Feature behavior
Shapley Summary Plot for Original Features (Kernel SHAP Method)
Shapley explanations are a technique with credible theoretical support that presents consistent global and ...
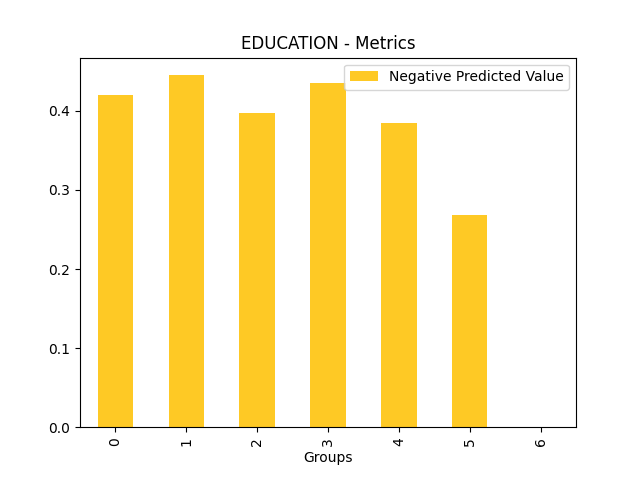
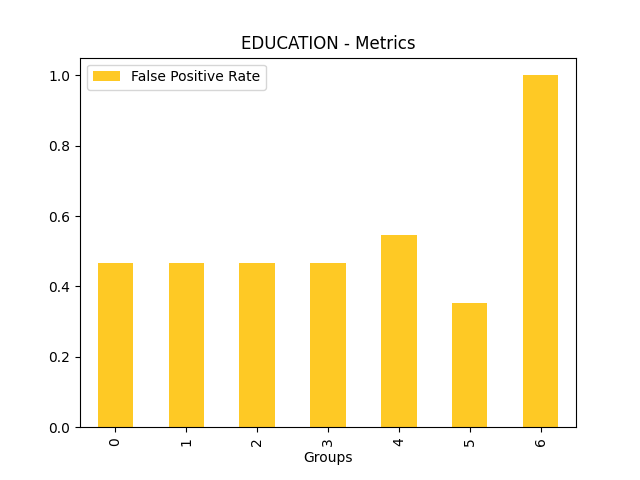
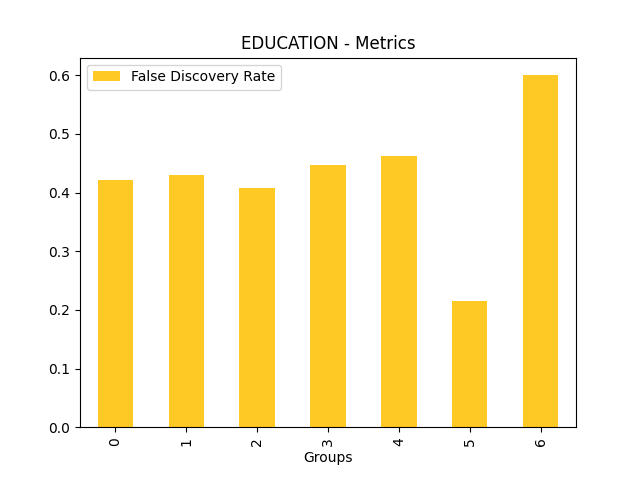
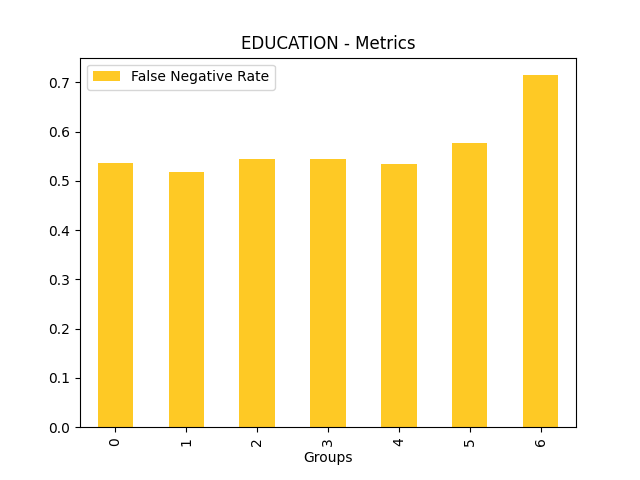
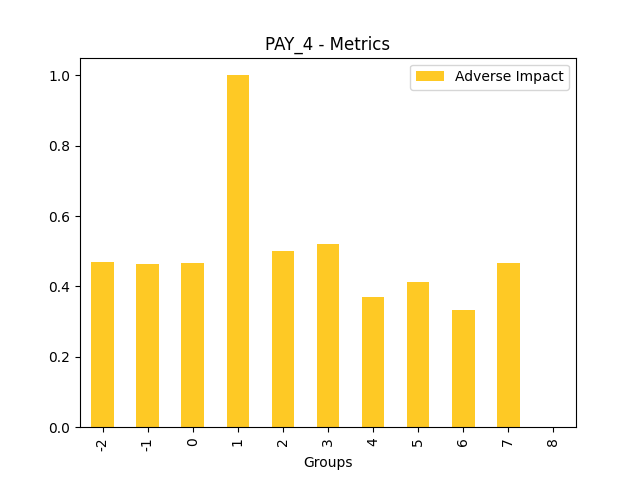
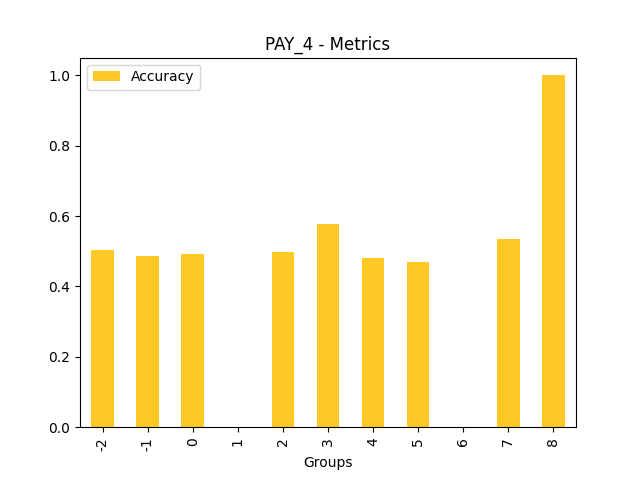
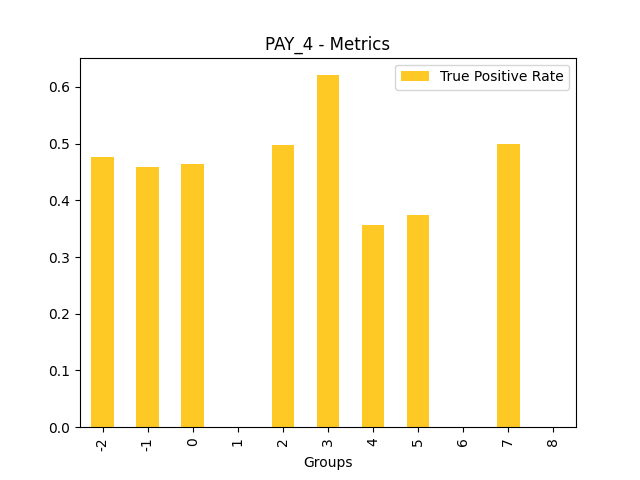
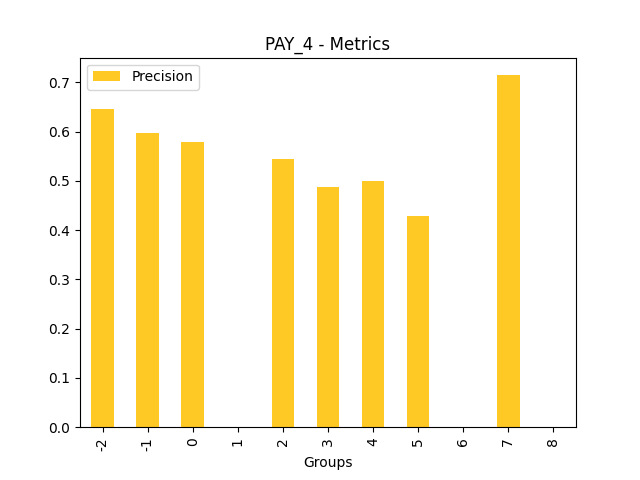
Fairness
Disparate Impact Analysis
Disparate Impact Analysis (DIA) is a technique that is used to evaluate fairness. Bias can be introduced to...
Model debugging
Residual Surrogate Decision Tree
The residual surrogate decision tree predicts which paths in the tree (paths explain approximate model beha...
Problems
Explainers identified the following problems:
| Severity | Type | Problem | Suggested actions | Explainer | Resources |
|---|---|---|---|---|---|
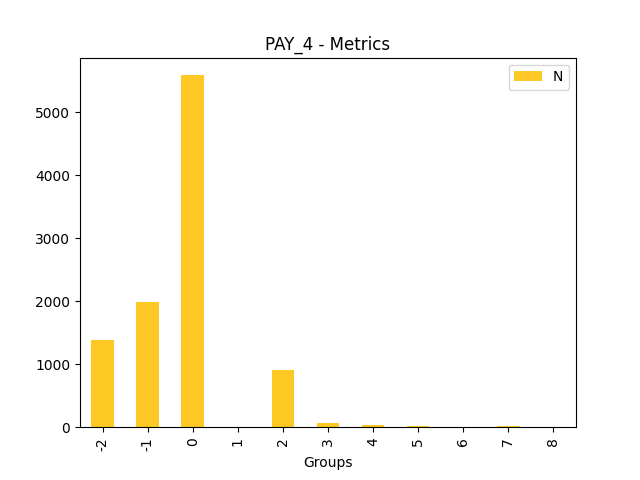
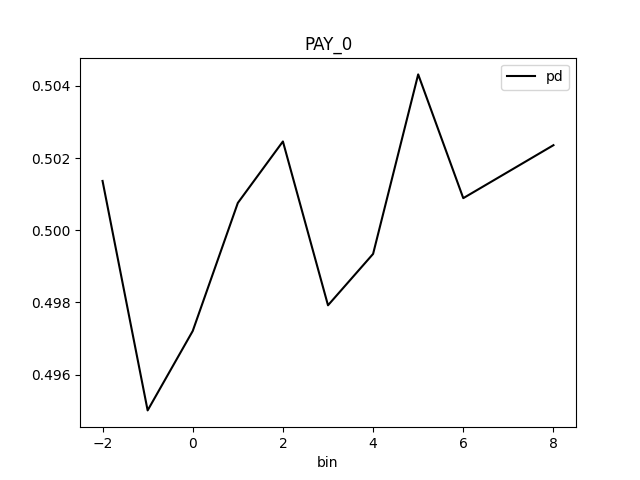
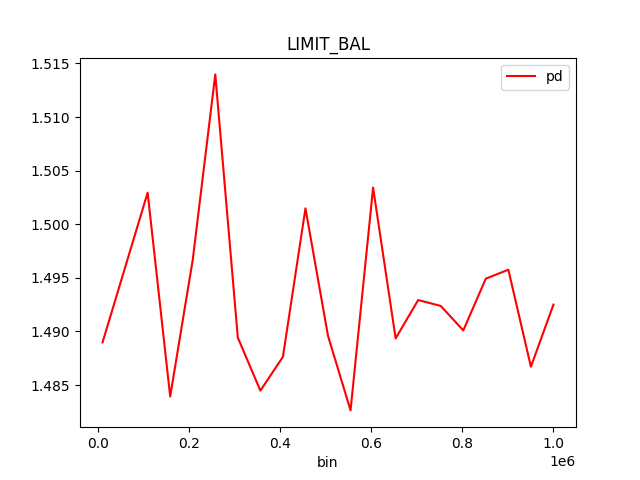
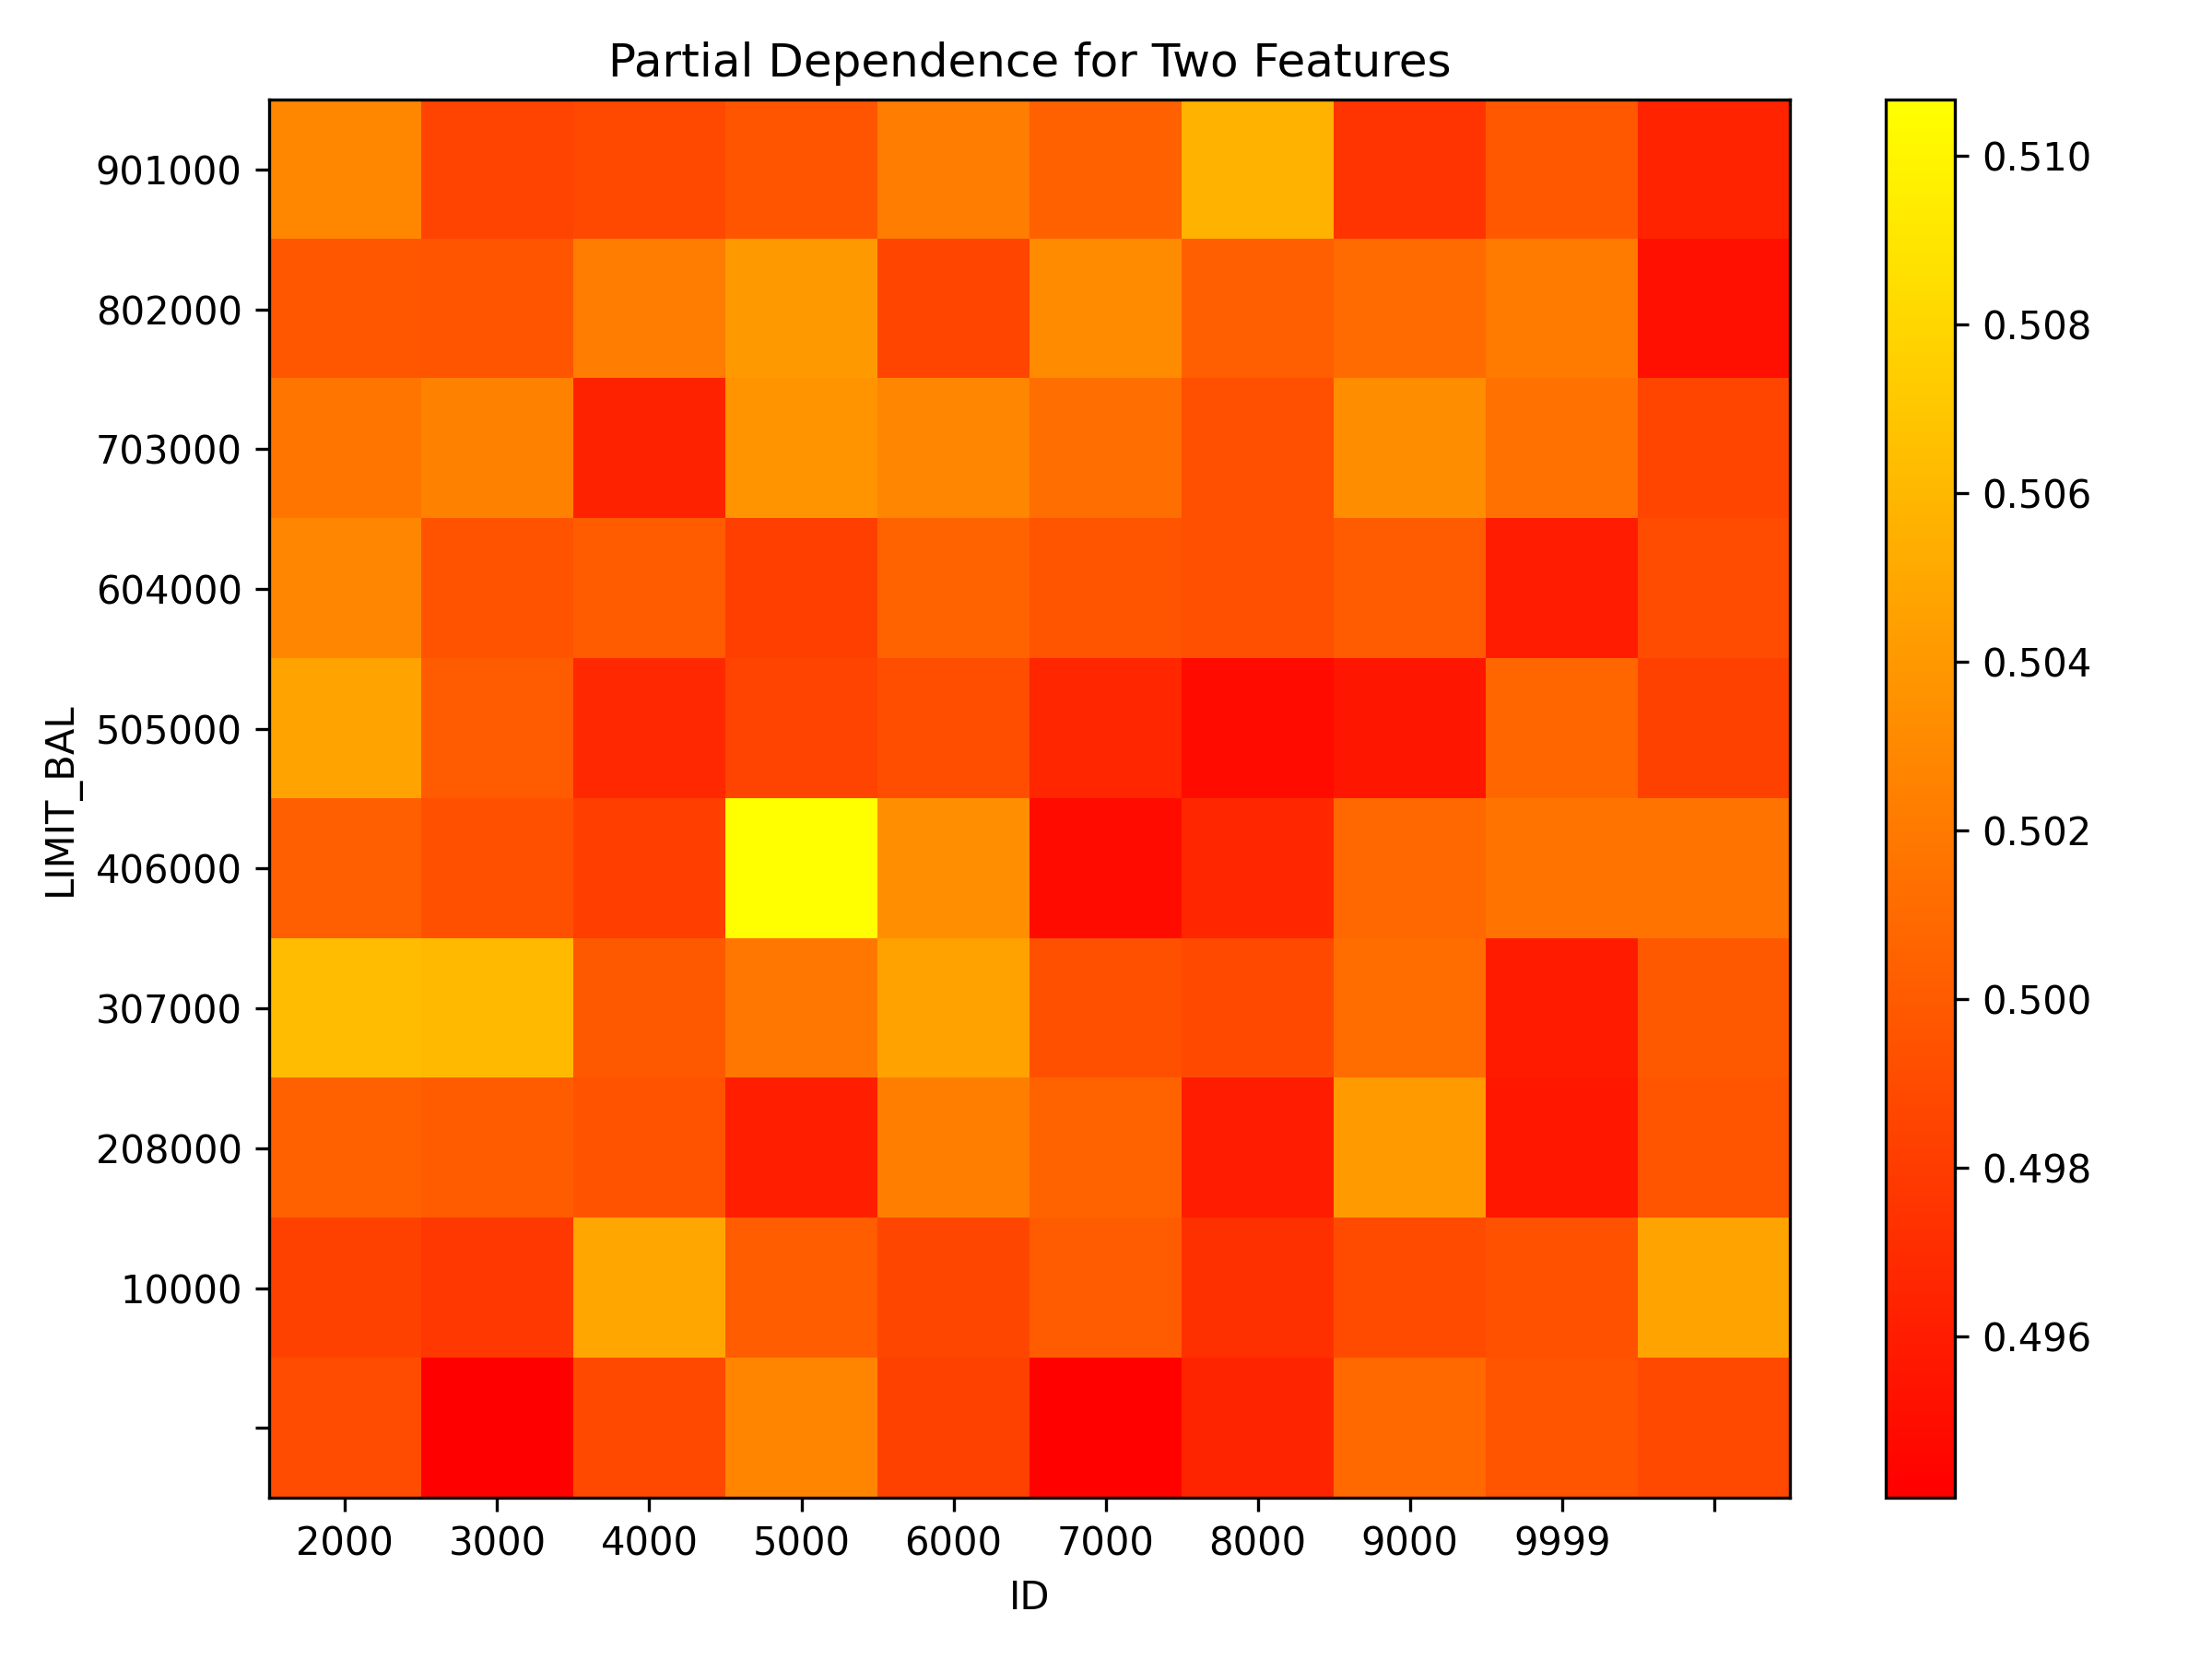
| MEDIUM | bias | The residual partial dependence plot of feature 'LIMIT_BAL' indicates the highest interaction of this feature with the error (residual abs(max-min) = 0.03134083655380704) from all the features used by the model (or features configured for PD calculation) | Verify that feature `LIMIT_BAL' error interaction does not indicate a model bias or other problem. | Residual Partial Dependence Plot | PartialDependenceExplanation / application/json |
| LOW | bias | A path in the residual surrogate decision tree leading to the largest residual (2.0222235) may indicate a problem in the model. | Verify that the following surrogate decision tree path does not indicate a model bias or other problem: IF (LIMIT_BAL >= 54956.0 OR LIMIT_BAL IS N/A) AND (AGE < 25.5) AND (LIMIT_BAL >= 65507.5 OR LIMIT_BAL IS N/A) THEN AVERAGE VALUE OF TARGET IS 2.0222235 | Residual Surrogate Decision Tree | GlobalDtExplanation / application/json |
Explainers
Scheduled explainers (10):
- Disparate Impact Analysis
- Residual Surrogate Decision Tree
- Surrogate Decision Tree
- Shapley Summary Plot for Original Features (Kernel SHAP Method)
- Partial Dependence Plot
- Residual Partial Dependence Plot
- Shapley Values for Original Features (Kernel SHAP Method)
- Partial Dependence Plot for Two Features
- Friedman's H-statistic
- Dataset and model insights explainer
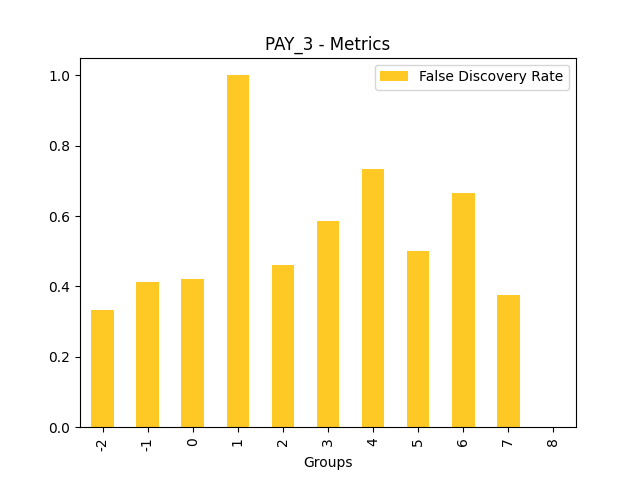
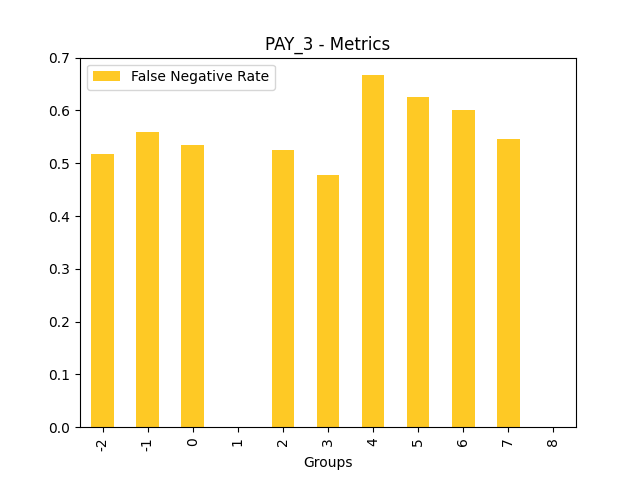
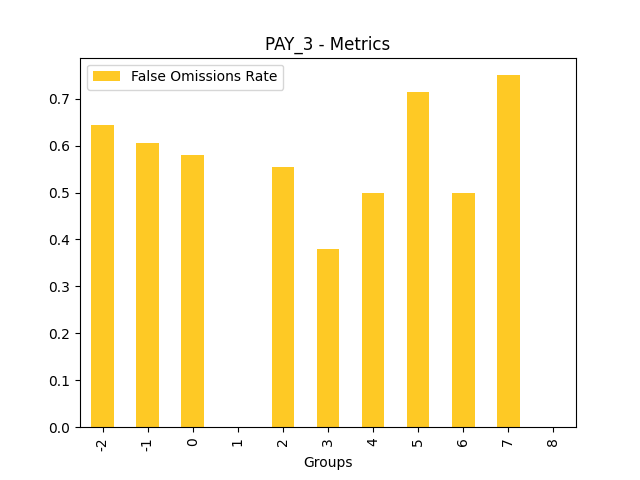
Explainer: Disparate Impact Analysis
Explainer description
Disparate Impact Analysis (DIA) is a technique that is used to evaluate fairness. Bias can be introduced to models during the process of collecting, processing, and labeling data as a result, it is important to determine whether a model is harming certain users by making a significant number of biased decisions. DIA typically works by comparing aggregate measurements of unprivileged groups to a privileged group. For instance, the proportion of the unprivileged group that receives the potentially harmful outcome is divided by the proportion of the privileged group that receives the same outcome - the resulting proportion is then used to determine whether the model is biased.
Explanations
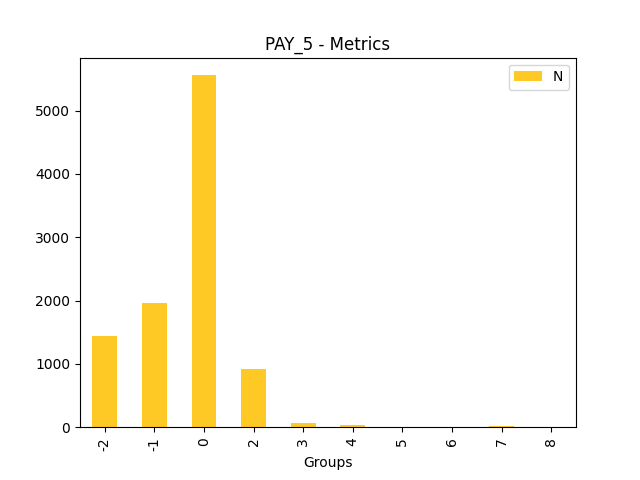
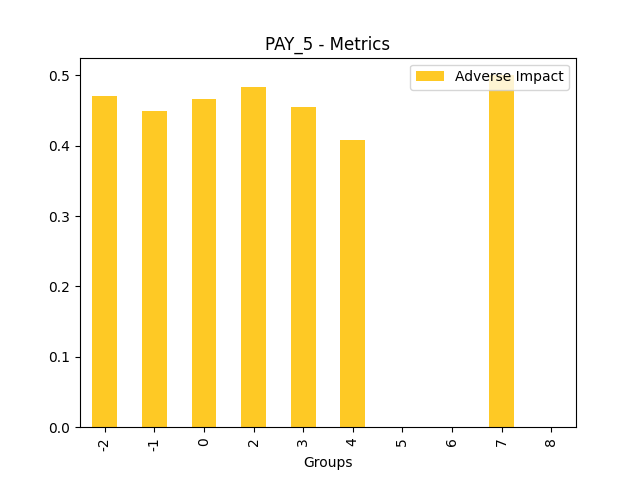
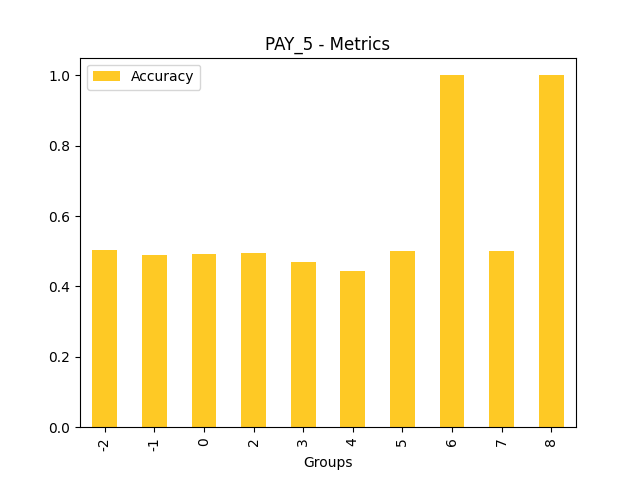
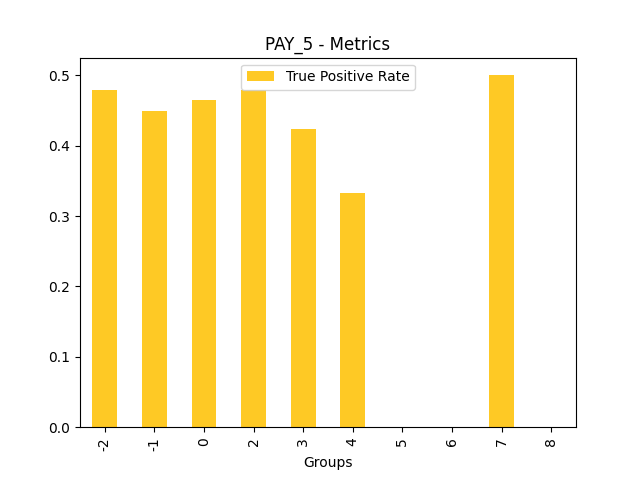
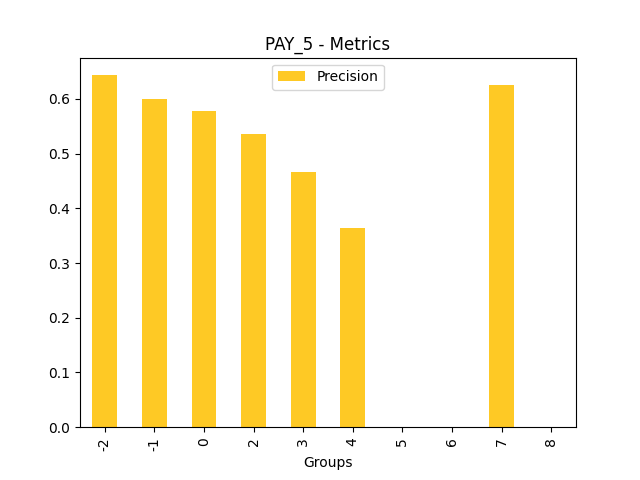
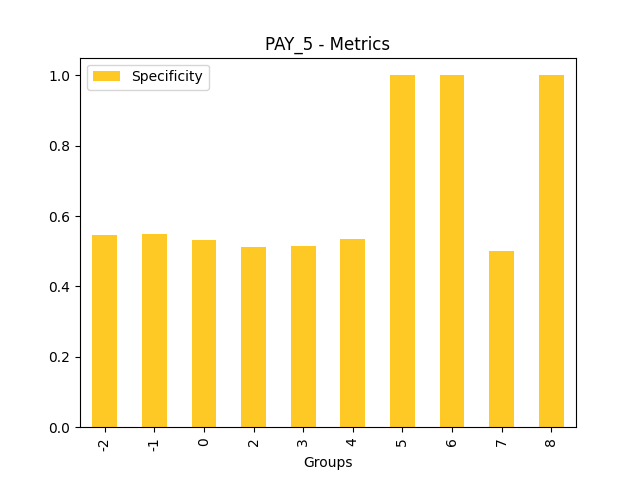
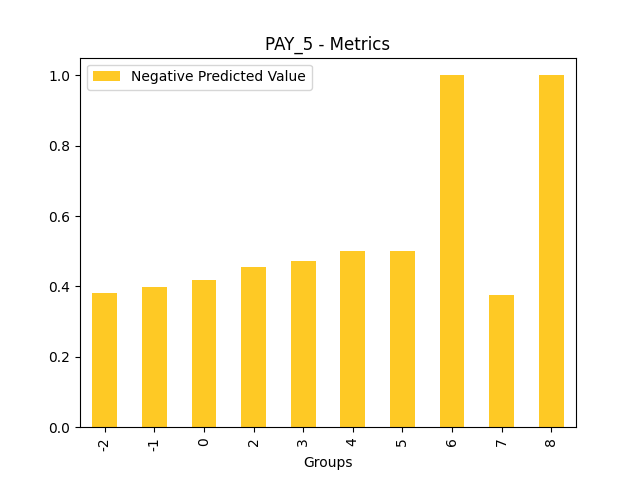
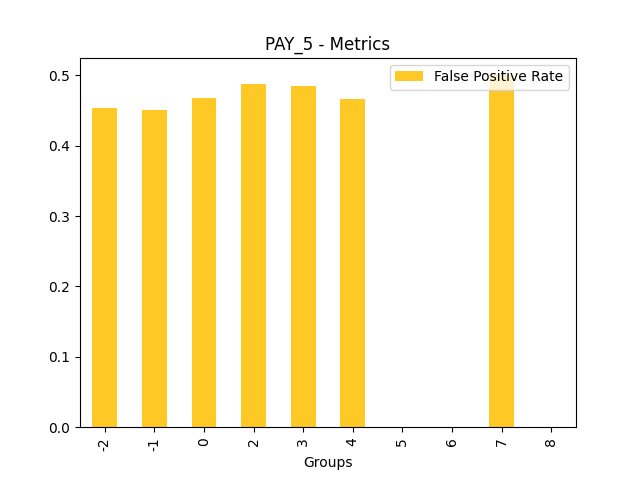
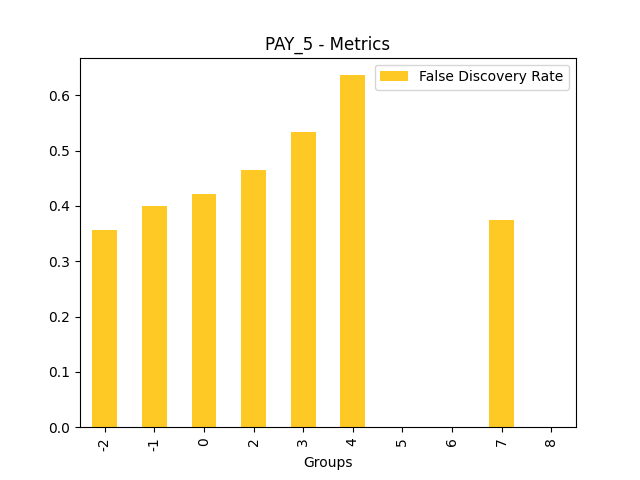
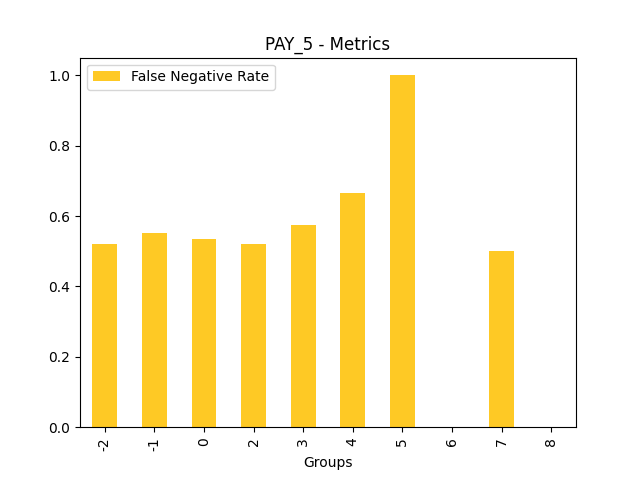
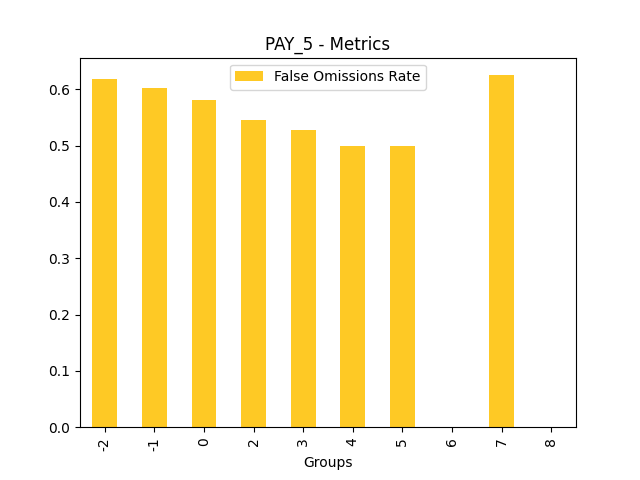
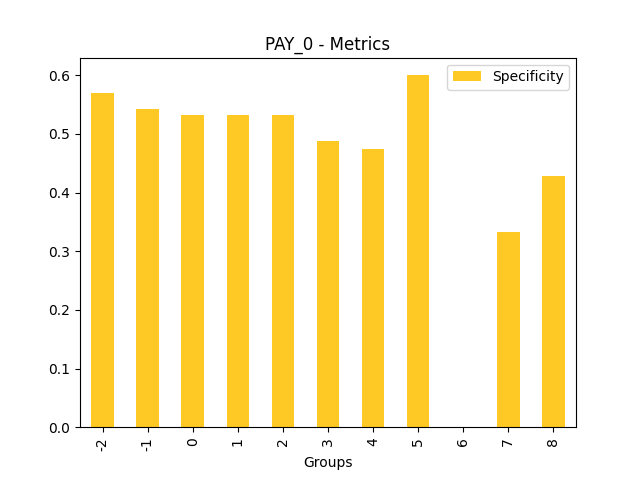
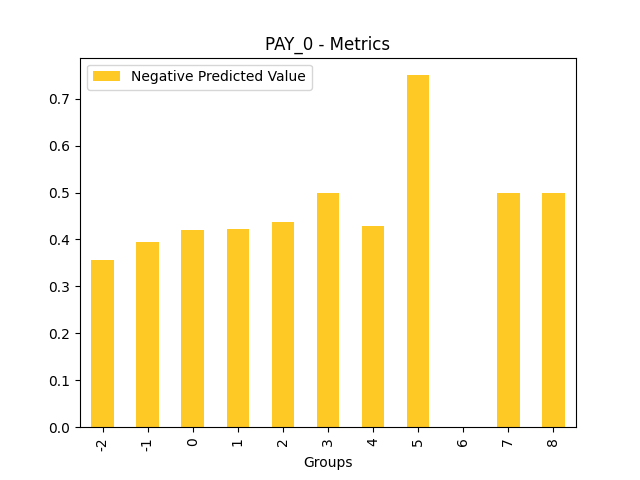
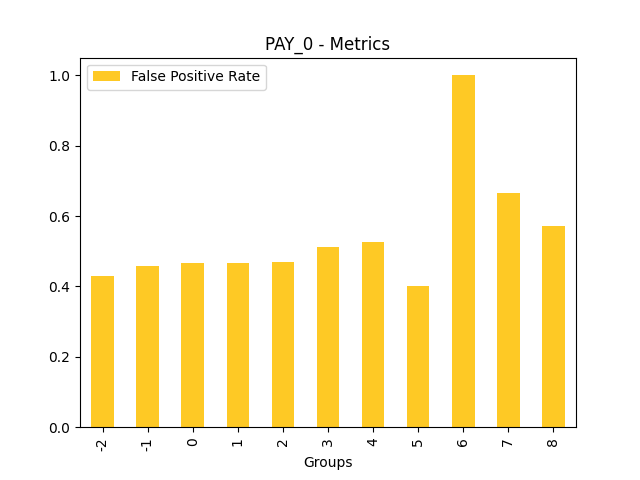
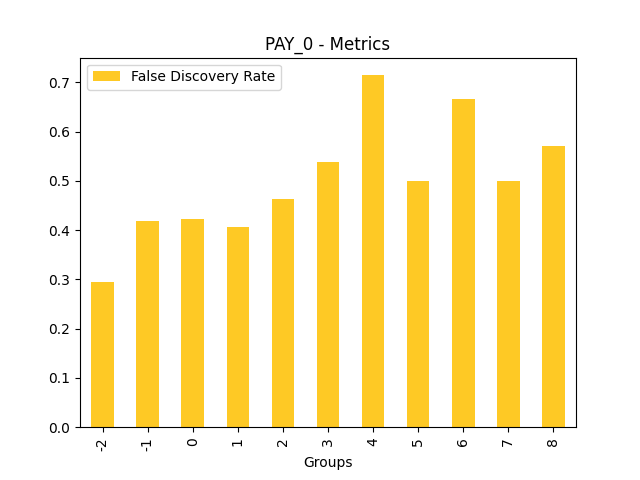
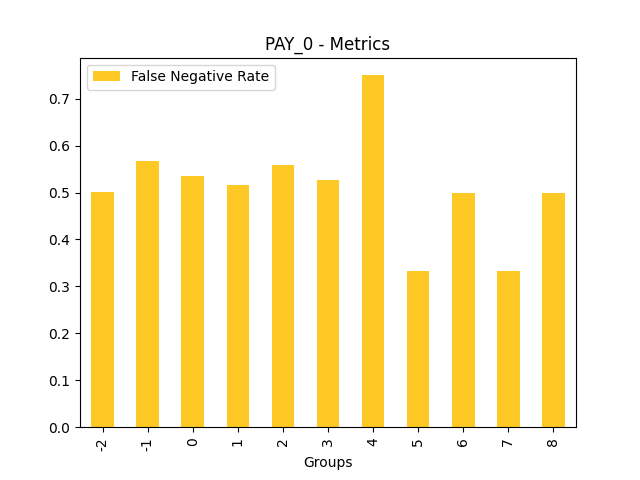
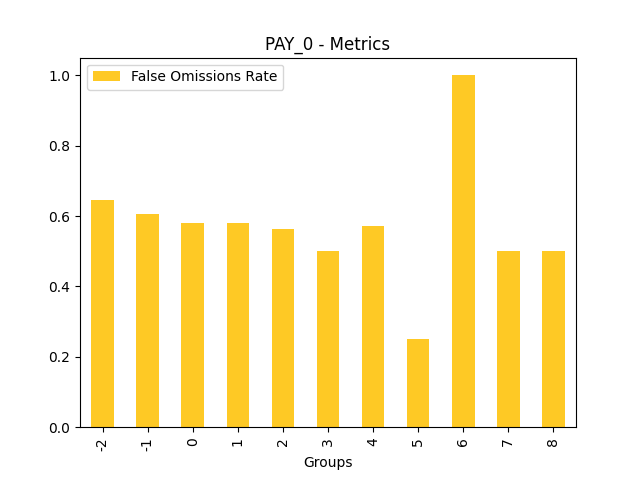
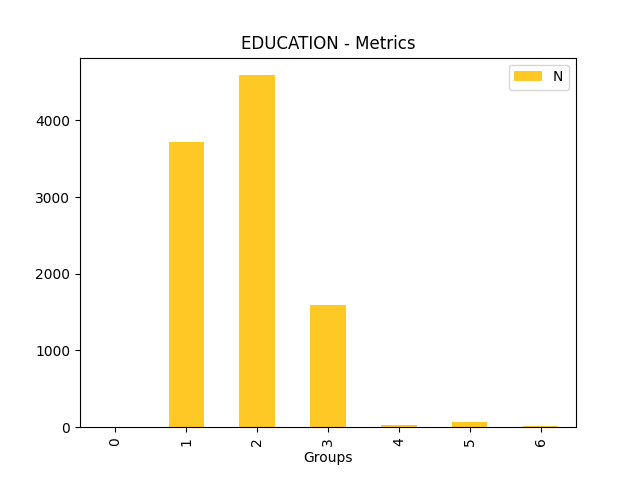
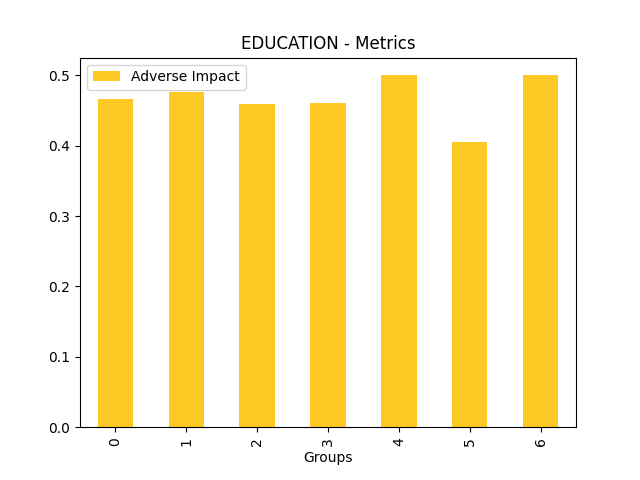
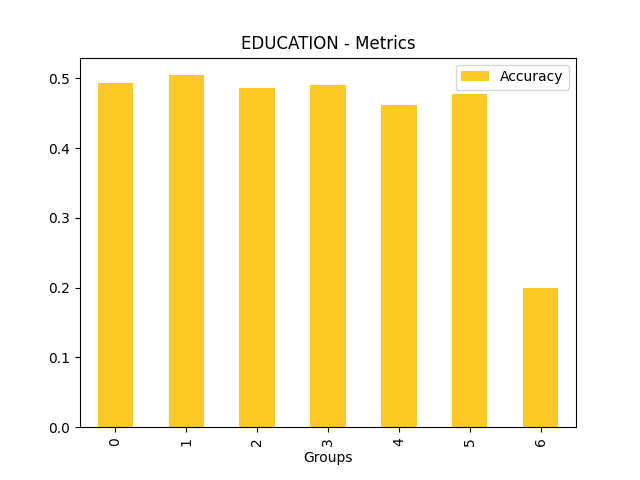
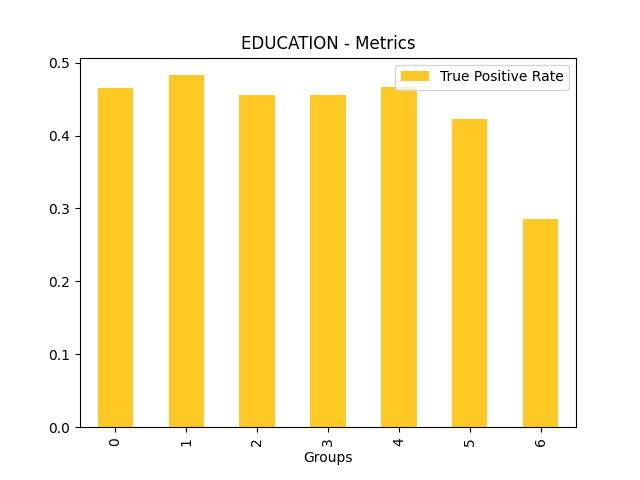
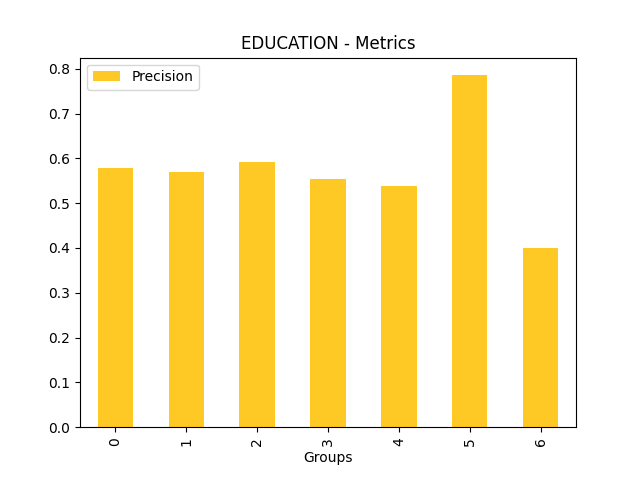
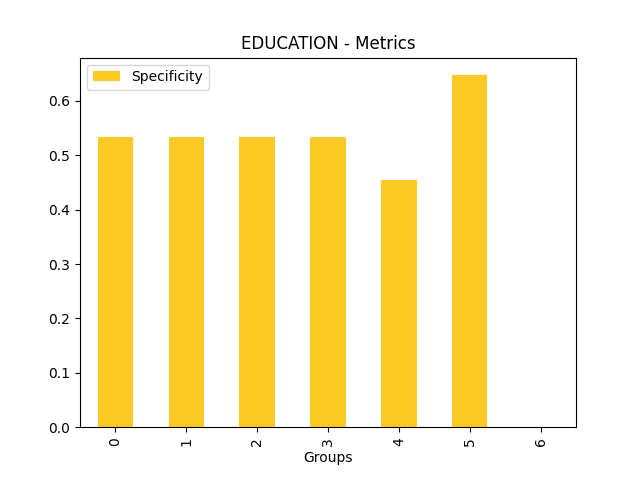
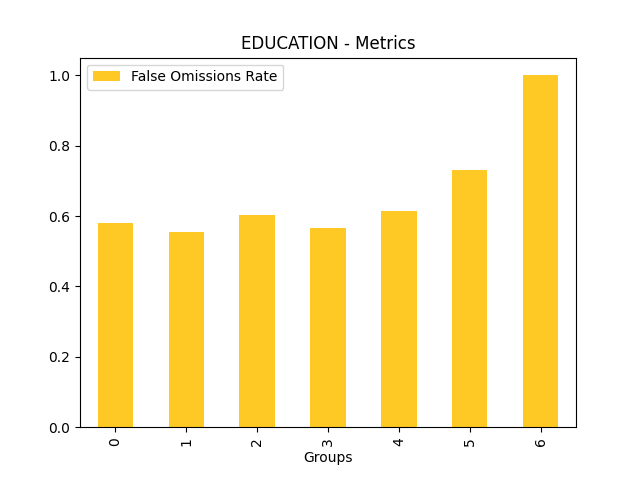
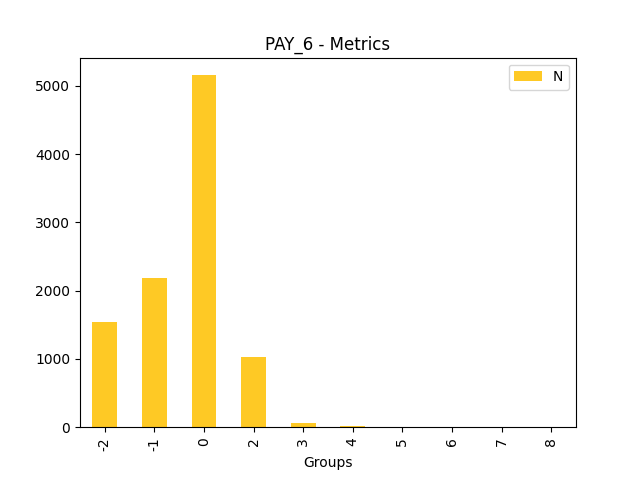
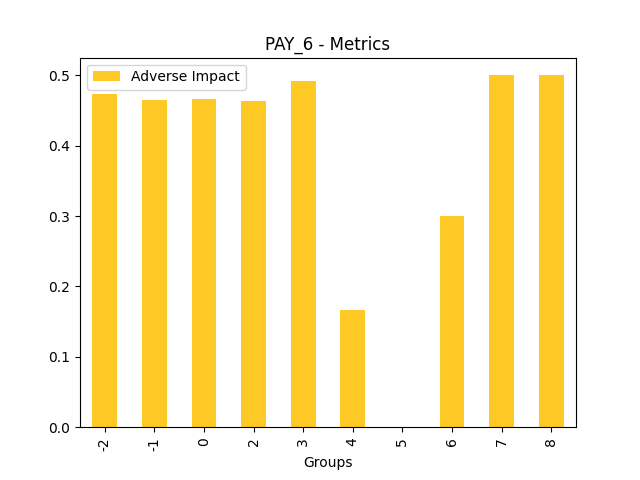
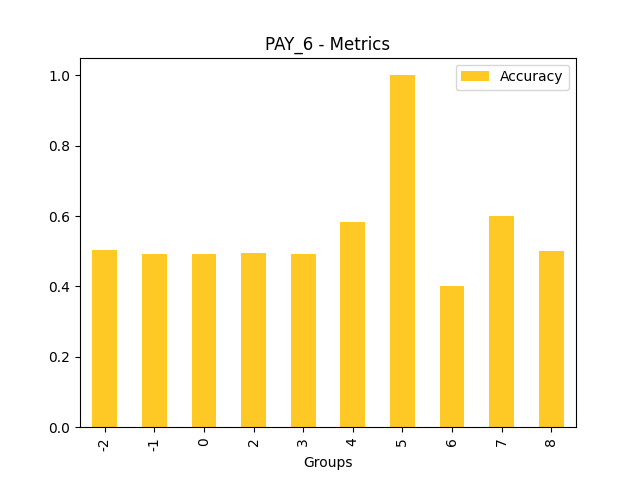
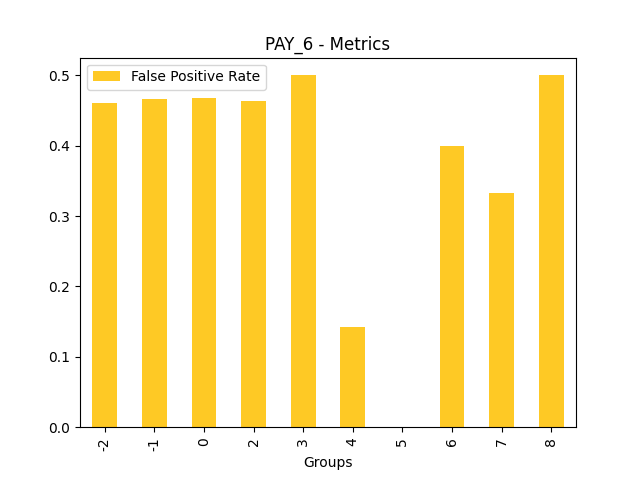
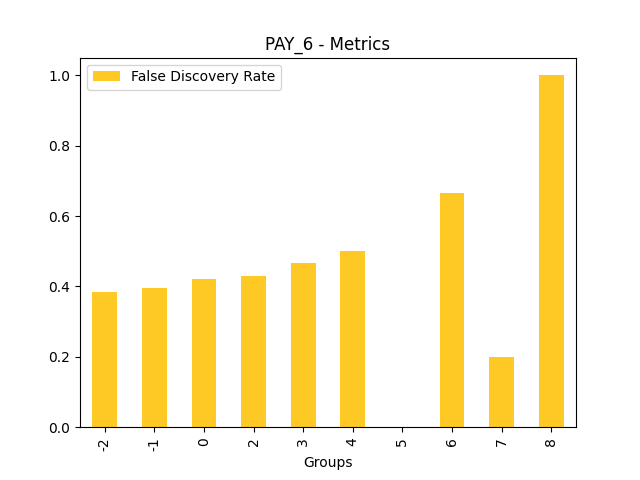
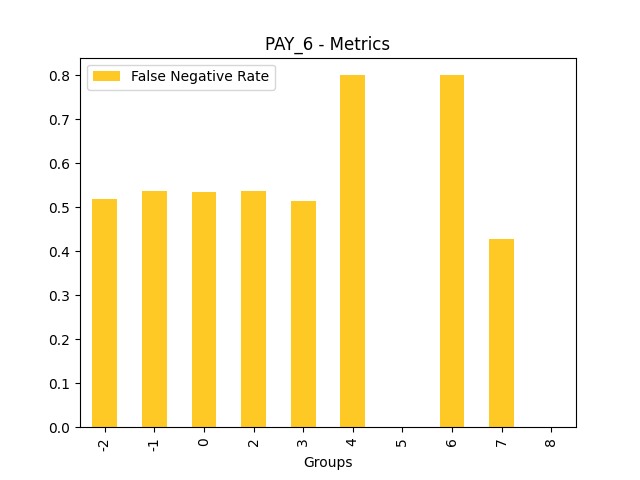
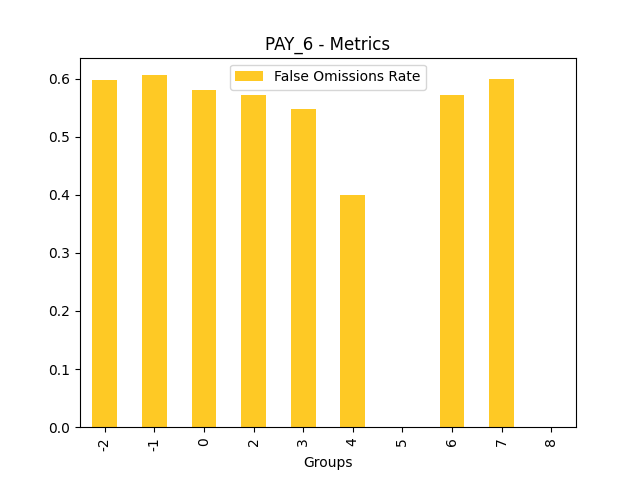
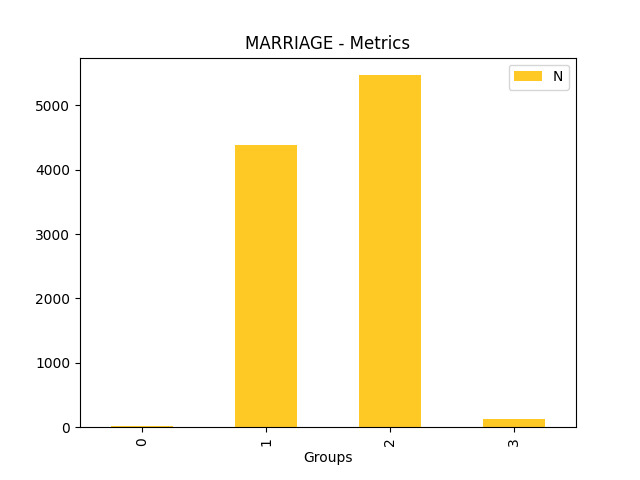
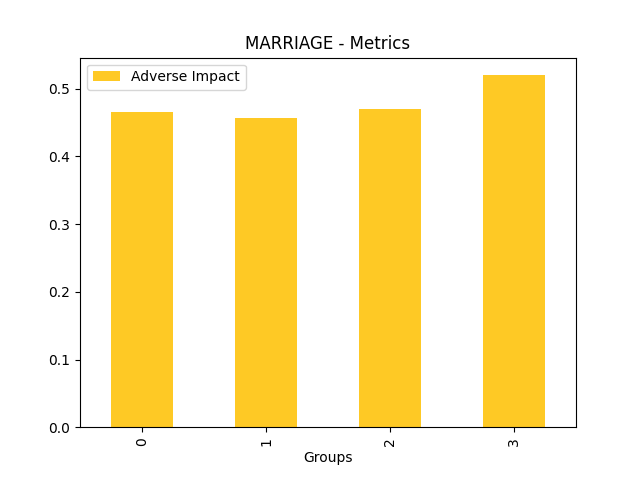
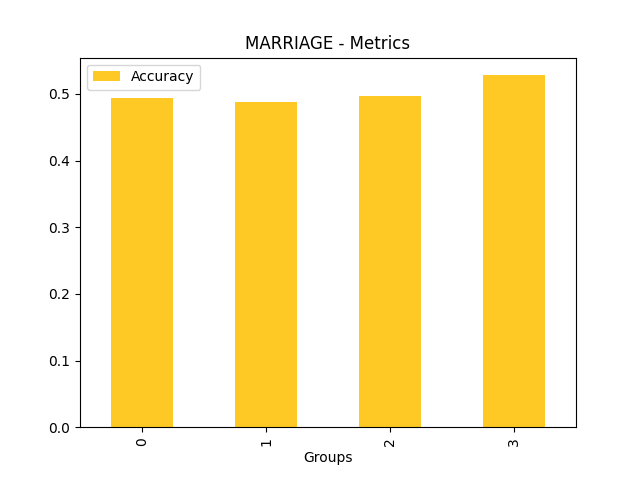
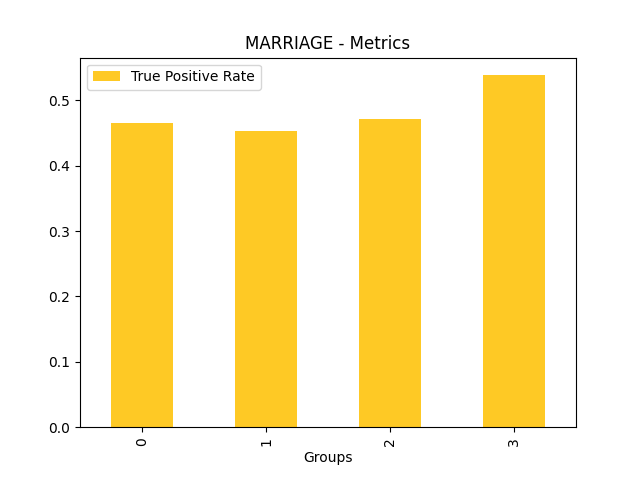
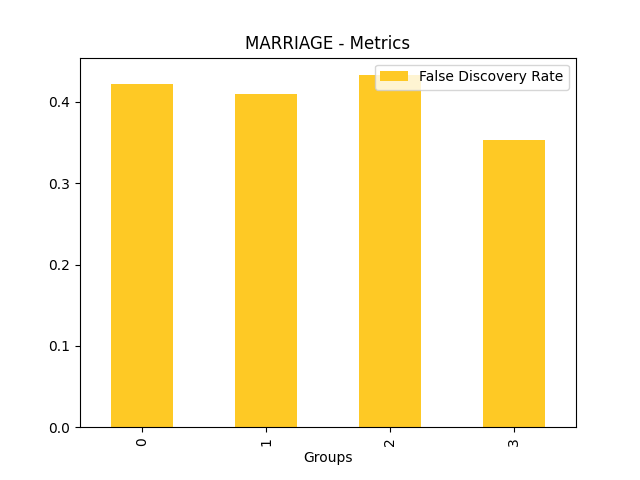
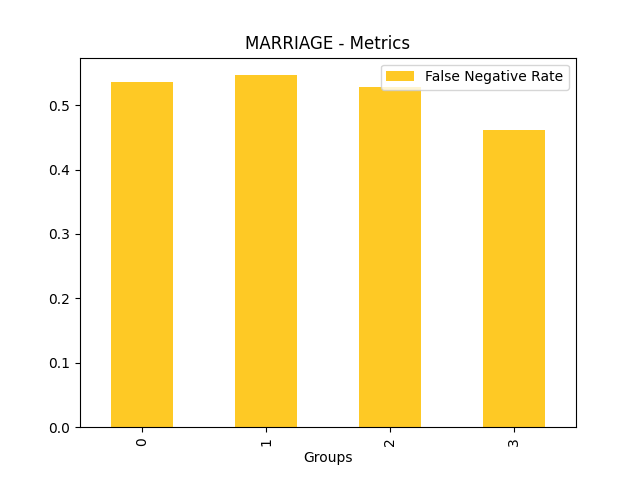
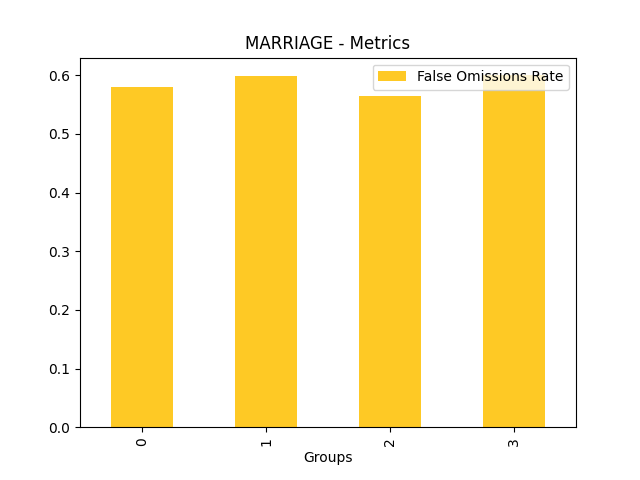
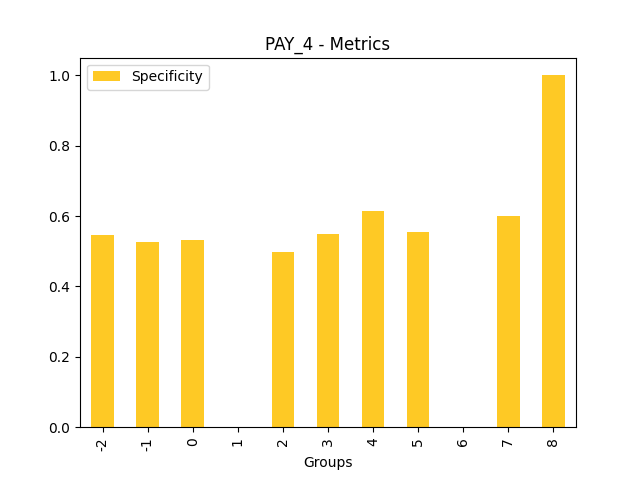
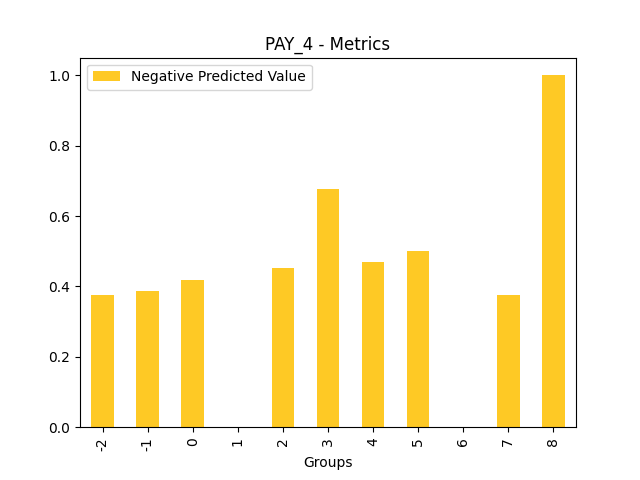
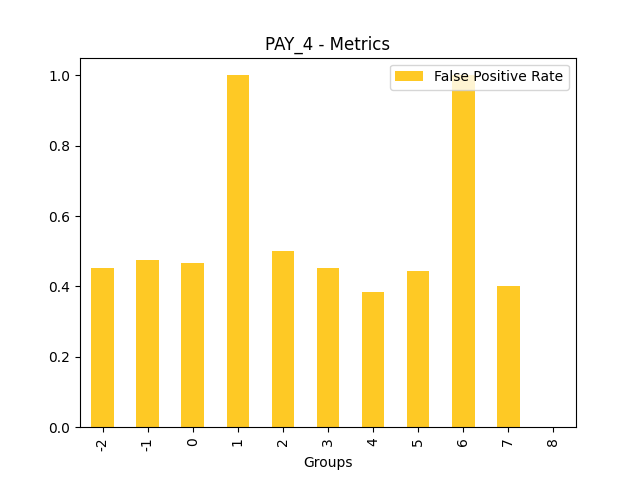
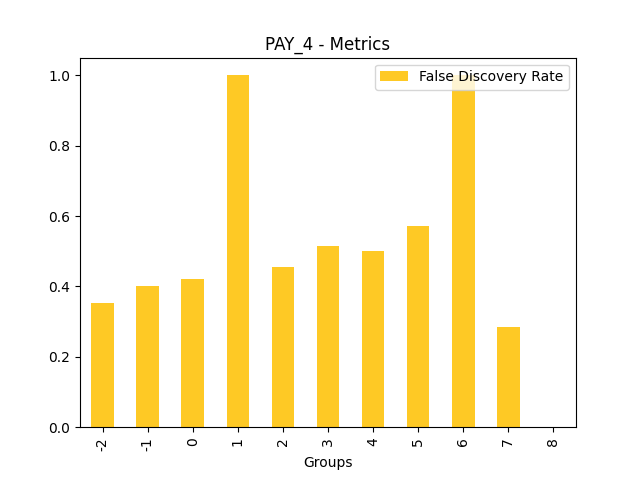
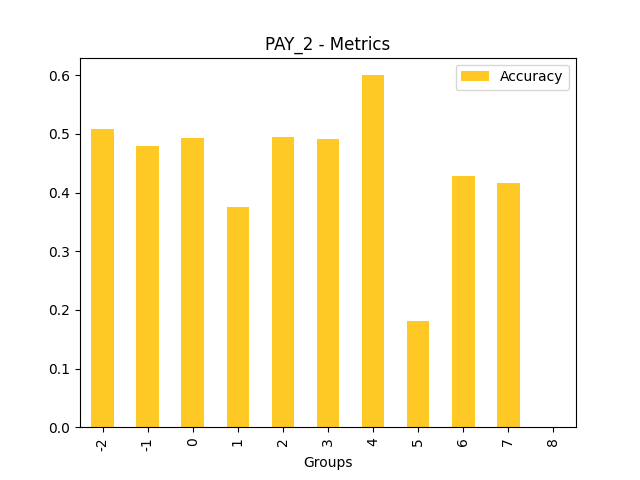
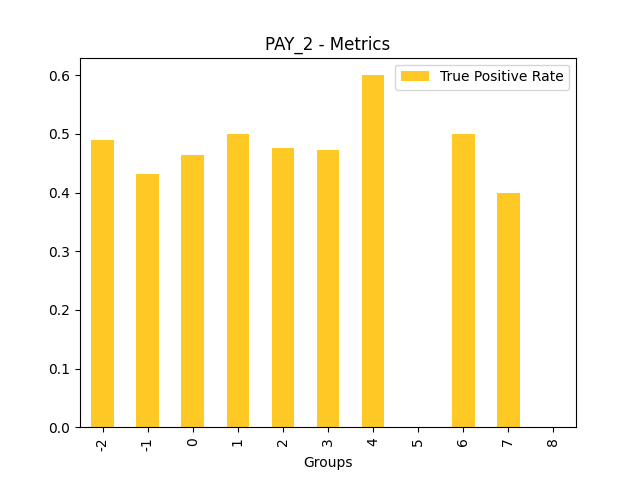
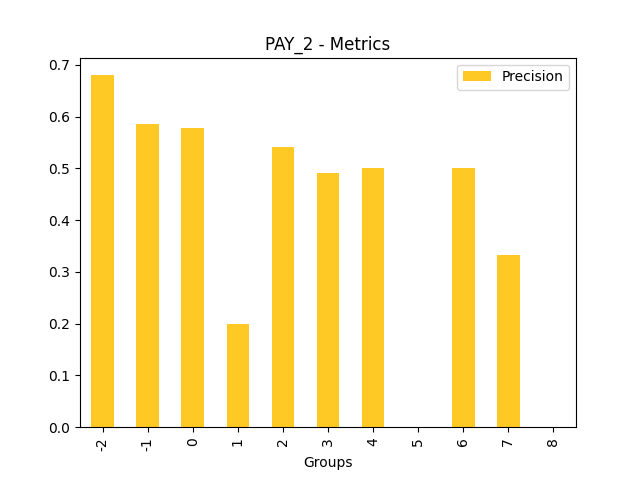
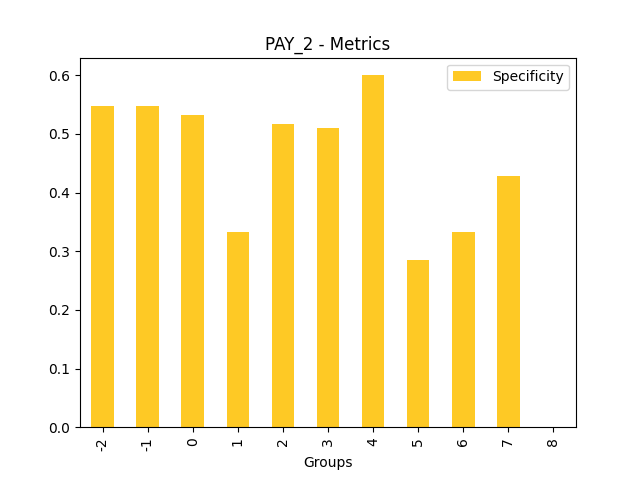
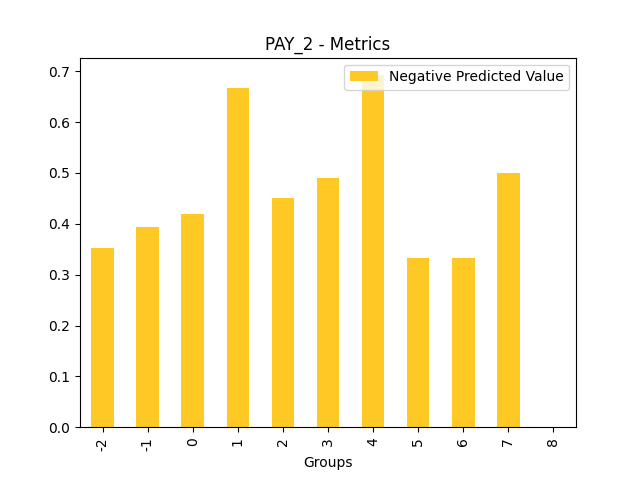
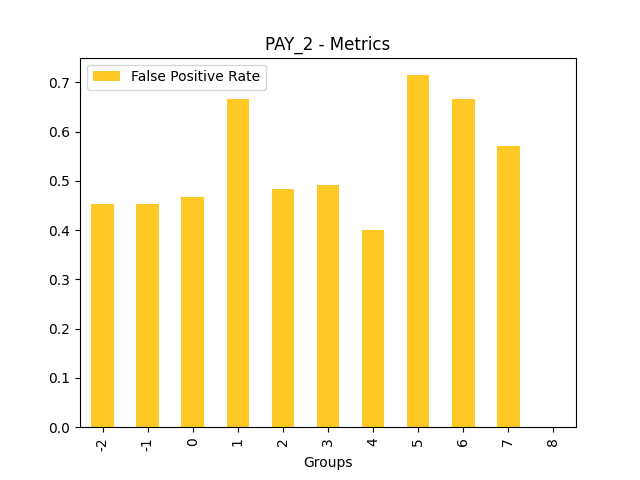
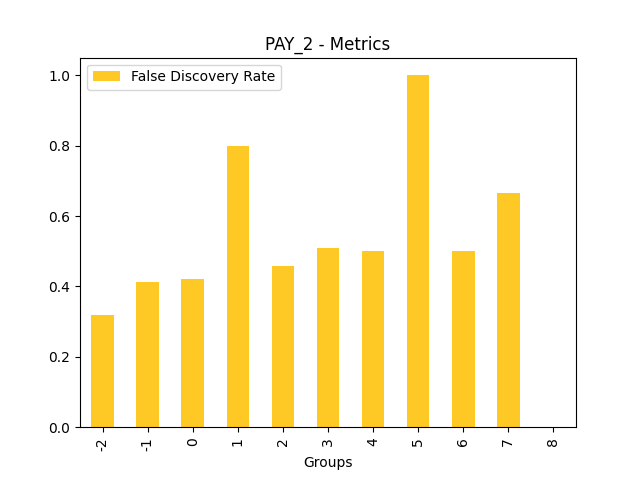
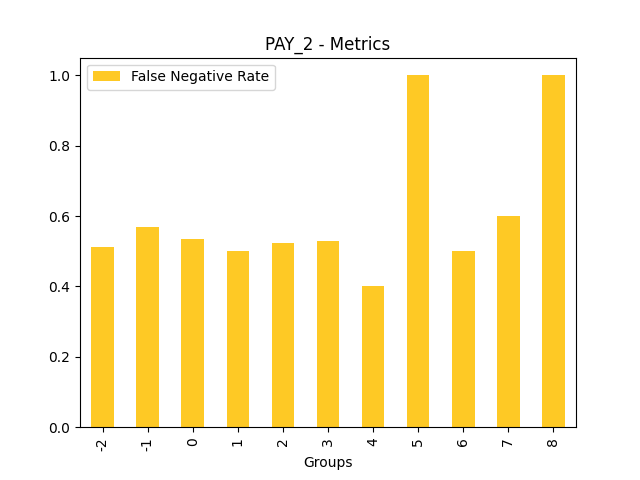
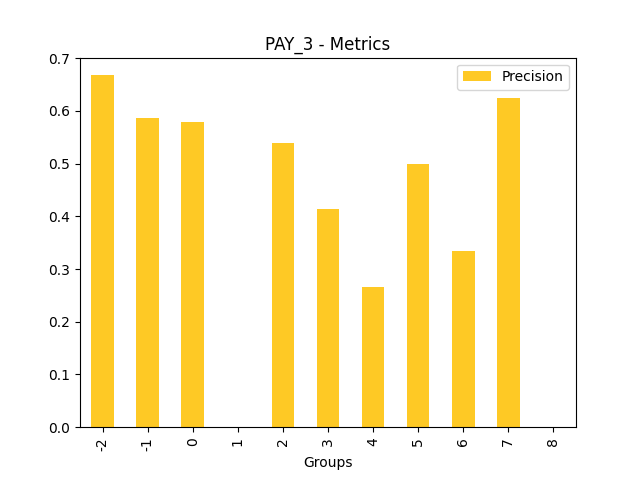
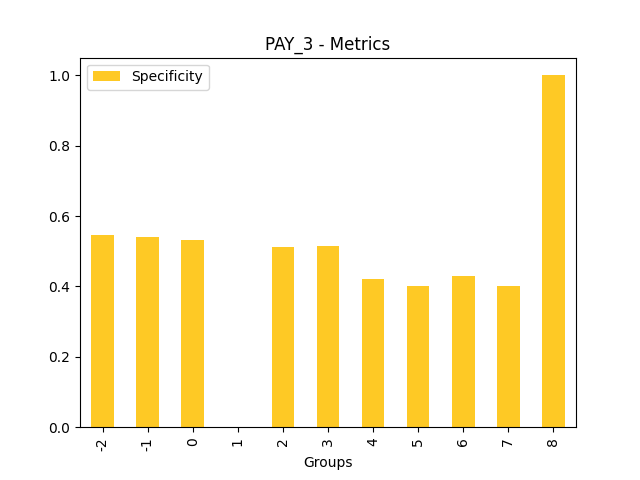
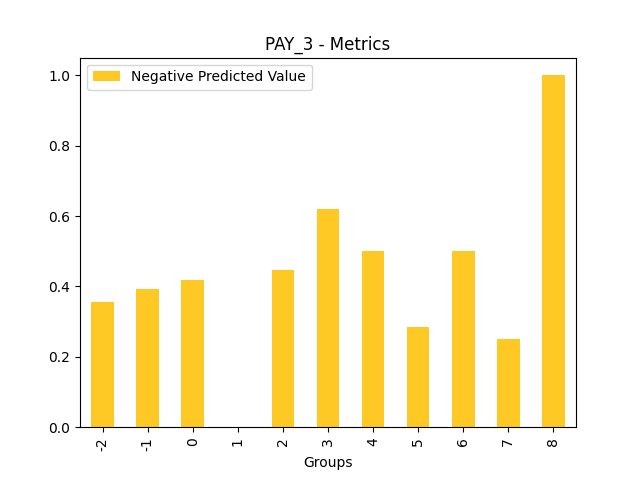
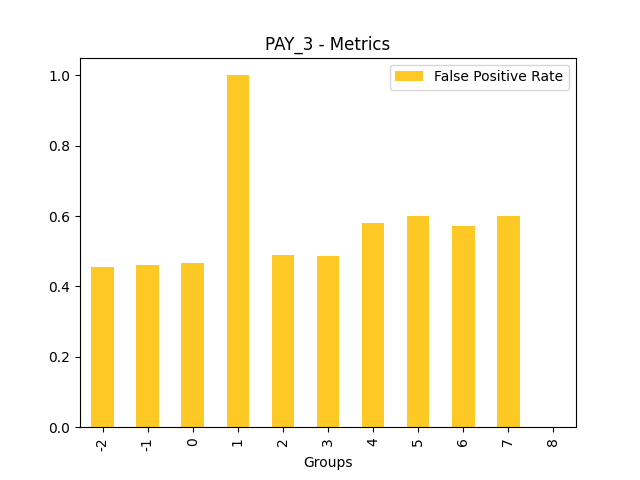
Fairness metrics for the feature: PAY_5

Explanations
Model explanations created by the explainer organized by explanation types with its formats (representations) identified by media types :-
Disparate Impact Analysis
global-disparate-impact-analysis -
Disparate Impact Analysis
global-html-fragment
Explainer parameters
Explainer was run with the following parameters:| Parameter | Value | Description | Type | Default value |
|---|---|---|---|---|
| dia_cols |
None
|
List of features for which to compute DIA. |
list
|
None
|
| cut_off |
0.0
|
Cut off. |
float
|
0.0
|
| maximize_metric |
F1
|
Maximize metric. |
str
|
F1
|
| max_cardinality |
10
|
Max cardinality for categorical variables. |
int
|
10
|
| min_cardinality |
2
|
Minimum cardinality for categorical variables. |
int
|
2
|
| num_card |
25
|
Max cardinality for numeric variables to be considered categorical. |
int
|
25
|
Explainer metadata
The explainer can explain model types:- regression
- binomial
- run-by-default
- explains-fairness
- h2o-sonar
Explainer run
Explainer run details:- Status code: SUCCESS
- Progress: 100%
- Started: 2026-01-30 17:30:59 T+0100
- Duration: 4.85s
Explainer log
Explainer log file:Explainer: Residual Surrogate Decision Tree
Problems
Explainer identified the following problems:
| Severity | Type | Problem | Suggested actions | Explainer | Resources |
|---|---|---|---|---|---|
| LOW | bias | A path in the residual surrogate decision tree leading to the largest residual (2.0222235) may indicate a problem in the model. | Verify that the following surrogate decision tree path does not indicate a model bias or other problem: IF (LIMIT_BAL >= 54956.0 OR LIMIT_BAL IS N/A) AND (AGE < 25.5) AND (LIMIT_BAL >= 65507.5 OR LIMIT_BAL IS N/A) THEN AVERAGE VALUE OF TARGET IS 2.0222235 | Residual Surrogate Decision Tree | GlobalDtExplanation / application/json |
Explainer description
The residual surrogate decision tree predicts which paths in the tree (paths explain approximate model behavior) lead to highest or lowest error. The residual surrogate decision tree is created by training a simple decision tree on the residuals of the predictions of the model. Residuals are differences between observed and predicted values which can be used as targets in surrogate models for the purpose of model debugging. The method used to calculate residuals varies depending on the type of problem. For classification problems, logloss residuals are calculated for a specified class (only one residual surrogate decision is created by the explainer and it is built for this class). For regression problems, residuals are determined by calculating the square of the difference between targeted and predicted values.
Explanations
Approximate model behavior for the class '1':
Explanations
Model explanations created by the explainer organized by explanation types with its formats (representations) identified by media types :-
Residual Decision Tree
global-decision-tree -
Local DT
local-decision-tree -
Surrogate Decision Tree
global-html-fragment -
Residual Decision tree surrogate rules ZIP archive
global-custom-archive
Explainer parameters
Explainer was run with the following parameters:| Parameter | Value | Description | Type | Default value |
|---|---|---|---|---|
| debug_residuals_class |
1
|
Class for debugging classification model logloss residuals, empty string for debugging regression model residuals. |
str
|
|
| dt_tree_depth |
3
|
Decision tree depth. |
int
|
3
|
| nfolds |
3
|
Number of CV folds. |
int
|
3
|
| qbin_cols |
None
|
Quantile binning columns. |
list
|
None
|
| qbin_count |
0
|
Quantile bins count. |
int
|
0
|
| categorical_encoding |
onehotexplicit
|
Categorical encoding. |
str
|
onehotexplicit
|
| debug_residuals |
True
|
|
|
Explainer metadata
The explainer can explain model types:- regression
- binomial
- multinomial
- run-by-default
- requires-h2o3
- explains-model-debugging
- surrogate
- h2o-sonar
Explainer run
Explainer run details:- Status code: SUCCESS
- Progress: 100%
- Started: 2026-01-30 17:31:04 T+0100
- Duration: 2.131s
Explainer log
Explainer log file:Explainer: Surrogate Decision Tree
Explainer description
The surrogate decision tree is an approximate overall flow chart of the model, created by training a simple decision tree on the original inputs and the predictions of the model.
Explanations
Approximate model behavior for the class '1':
Explanations
Model explanations created by the explainer organized by explanation types with its formats (representations) identified by media types :-
Decision Tree
global-decision-tree -
Local DT
local-decision-tree -
Surrogate Decision Tree
global-html-fragment -
Decision tree surrogate rules ZIP archive
global-custom-archive
Explainer parameters
Explainer was run with the following parameters:| Parameter | Value | Description | Type | Default value |
|---|---|---|---|---|
| debug_residuals |
False
|
Debug model residuals. |
bool
|
False
|
| debug_residuals_class |
|
Class for debugging classification model logloss residuals, empty string for debugging regression model residuals. |
str
|
|
| dt_tree_depth |
3
|
Decision tree depth. |
int
|
3
|
| nfolds |
3
|
Number of CV folds. |
int
|
3
|
| qbin_cols |
None
|
Quantile binning columns. |
list
|
None
|
| qbin_count |
0
|
Quantile bins count. |
int
|
0
|
| categorical_encoding |
onehotexplicit
|
Categorical encoding. |
str
|
onehotexplicit
|
Explainer metadata
The explainer can explain model types:- regression
- binomial
- multinomial
- run-by-default
- requires-h2o3
- surrogate
- explains-approximate-behavior
- h2o-sonar
Explainer run
Explainer run details:- Status code: SUCCESS
- Progress: 100%
- Started: 2026-01-30 17:31:06 T+0100
- Duration: 2.179s
Explainer log
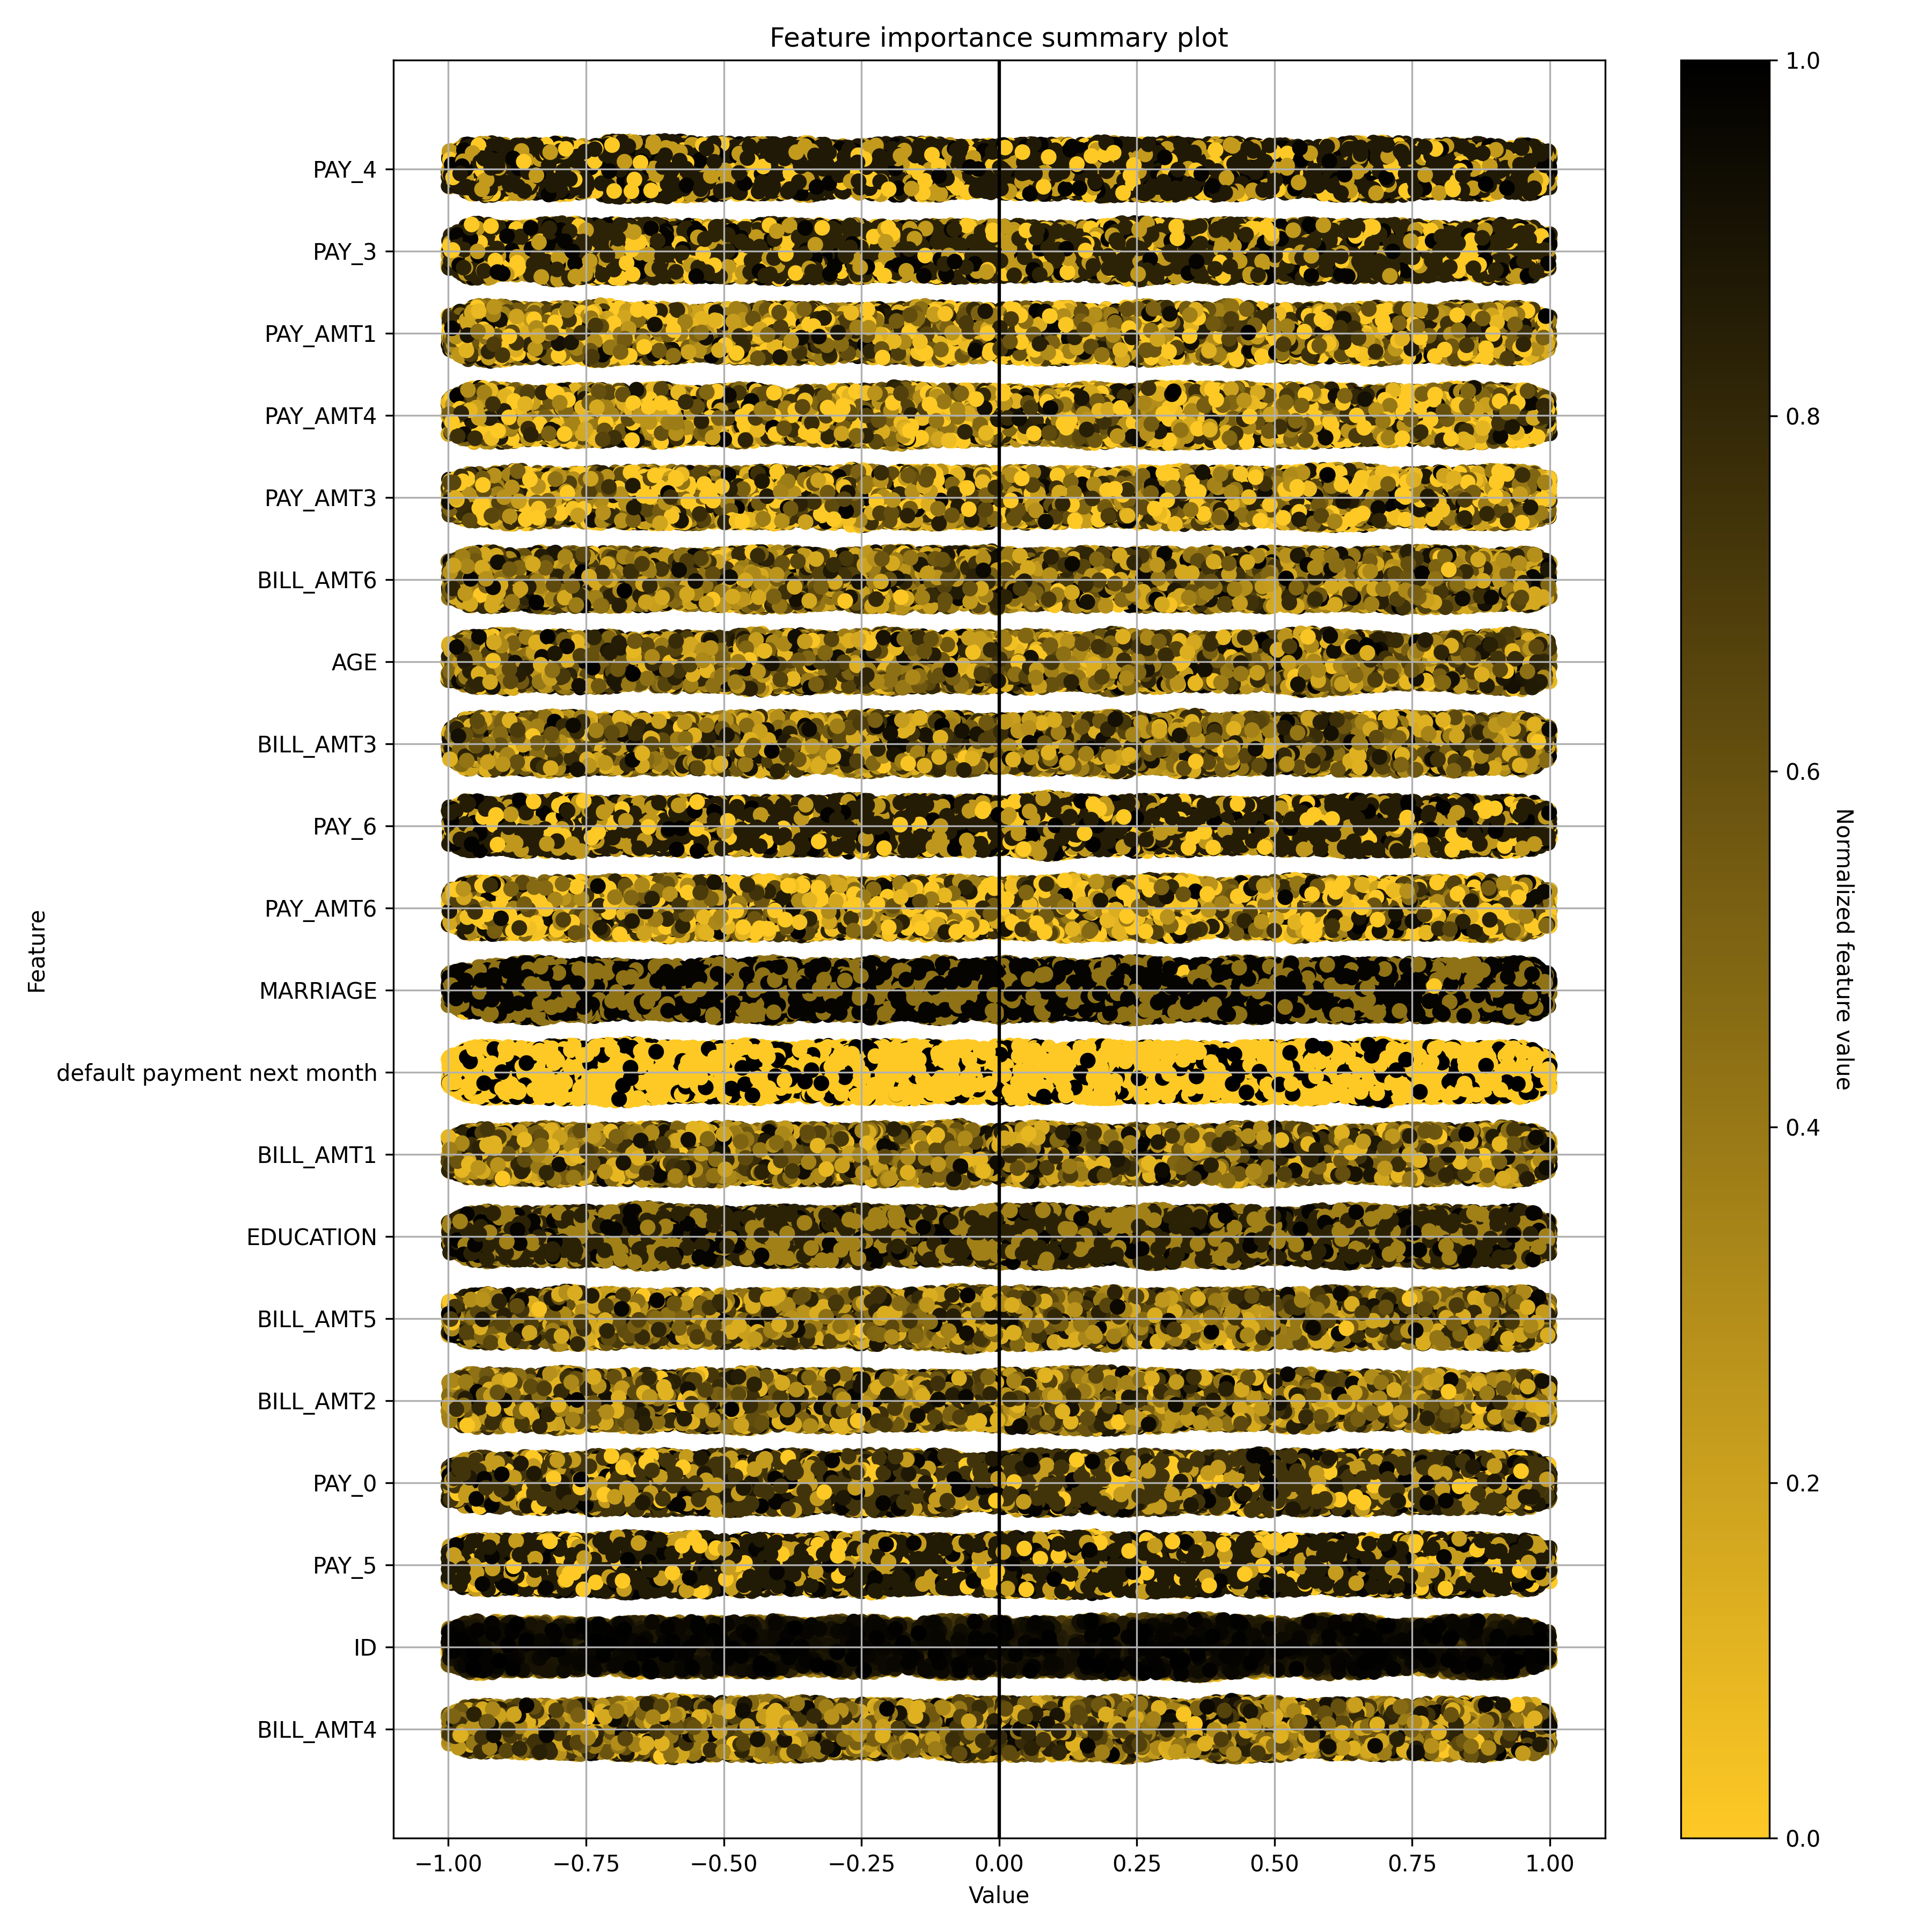
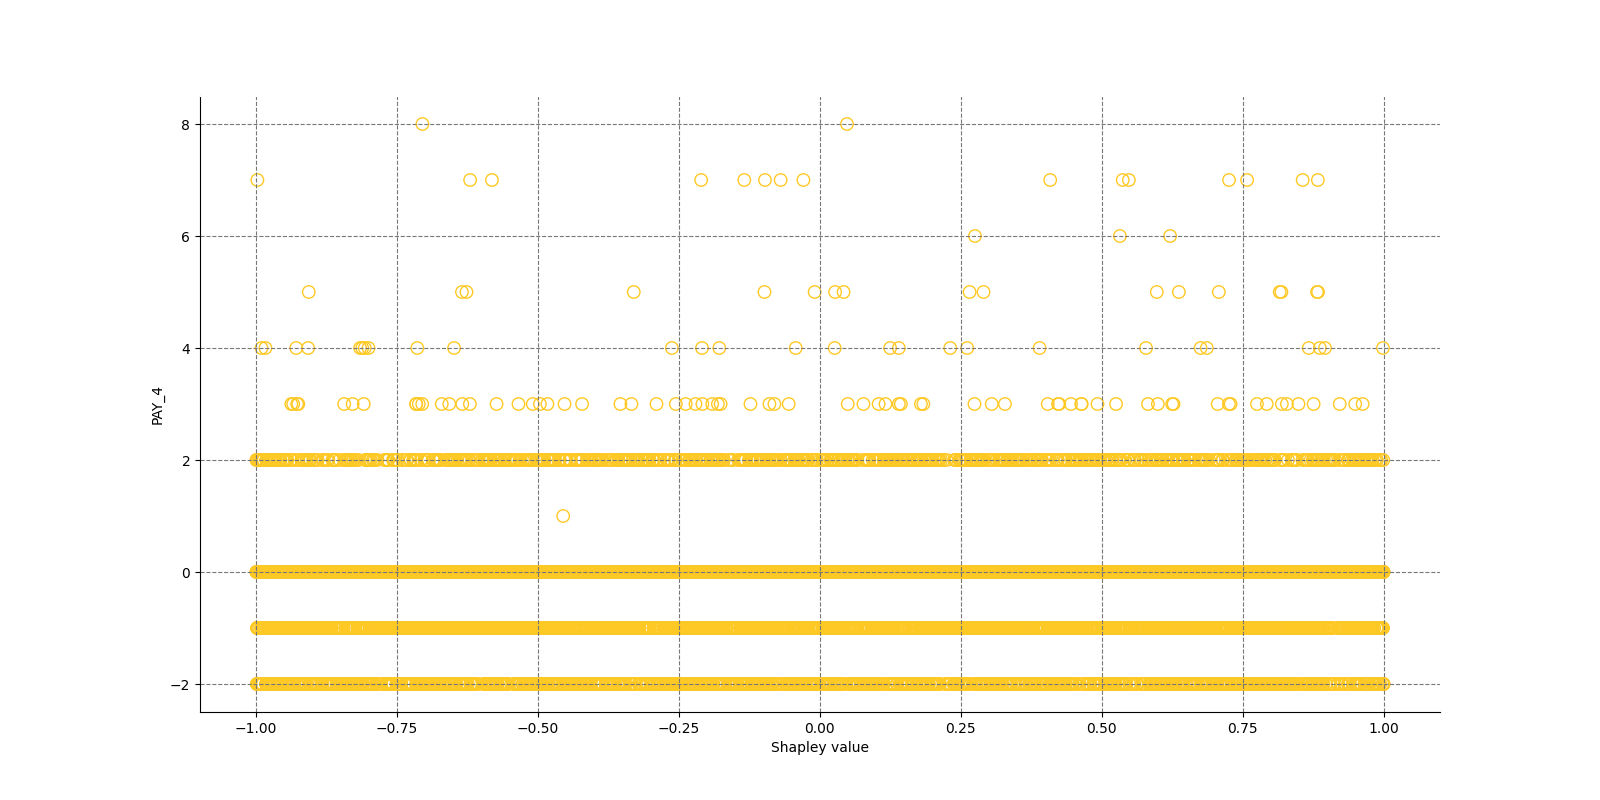
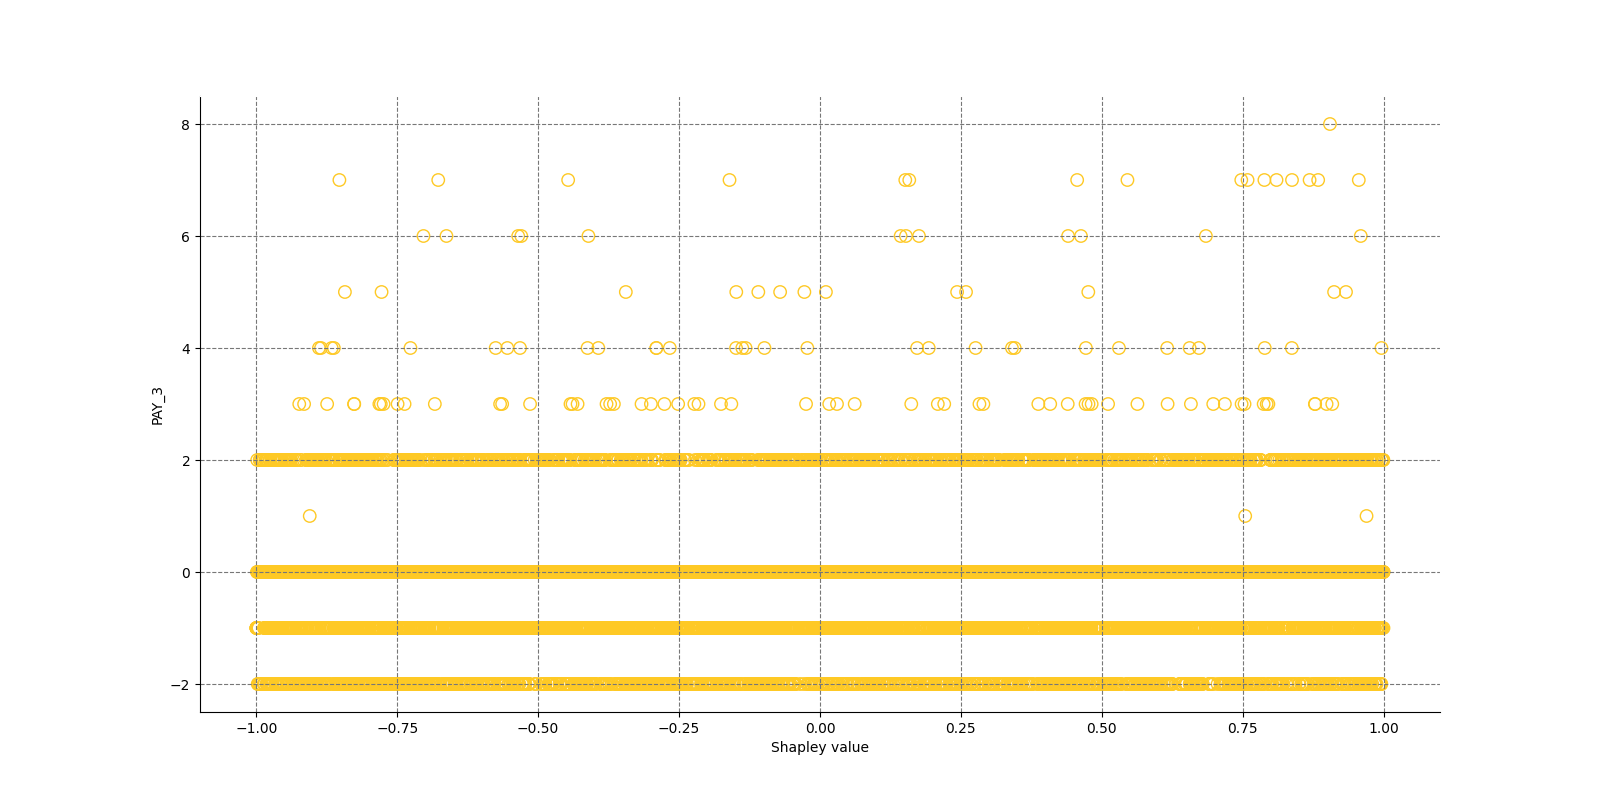
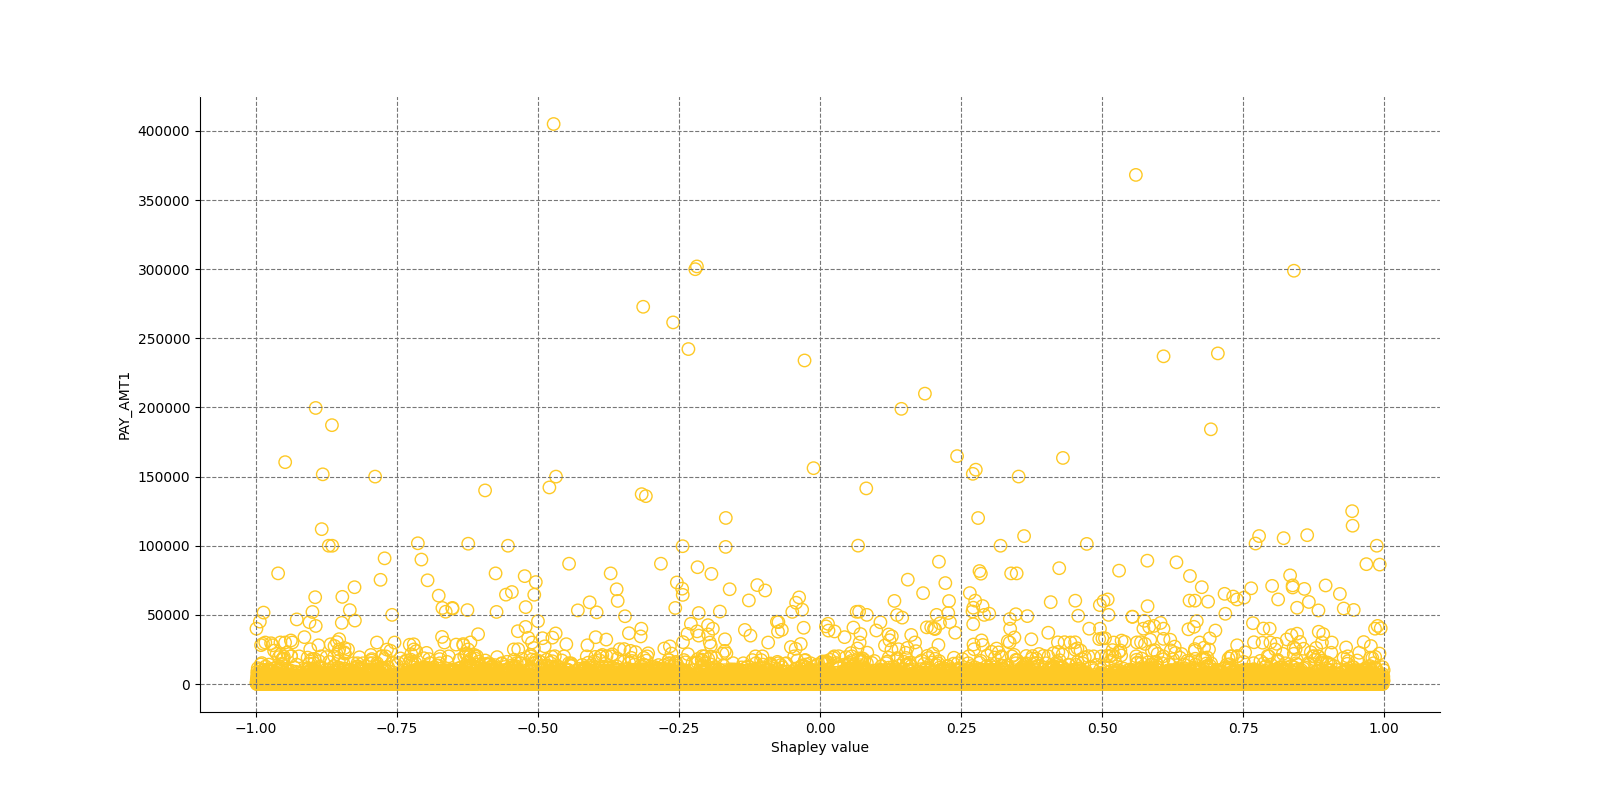
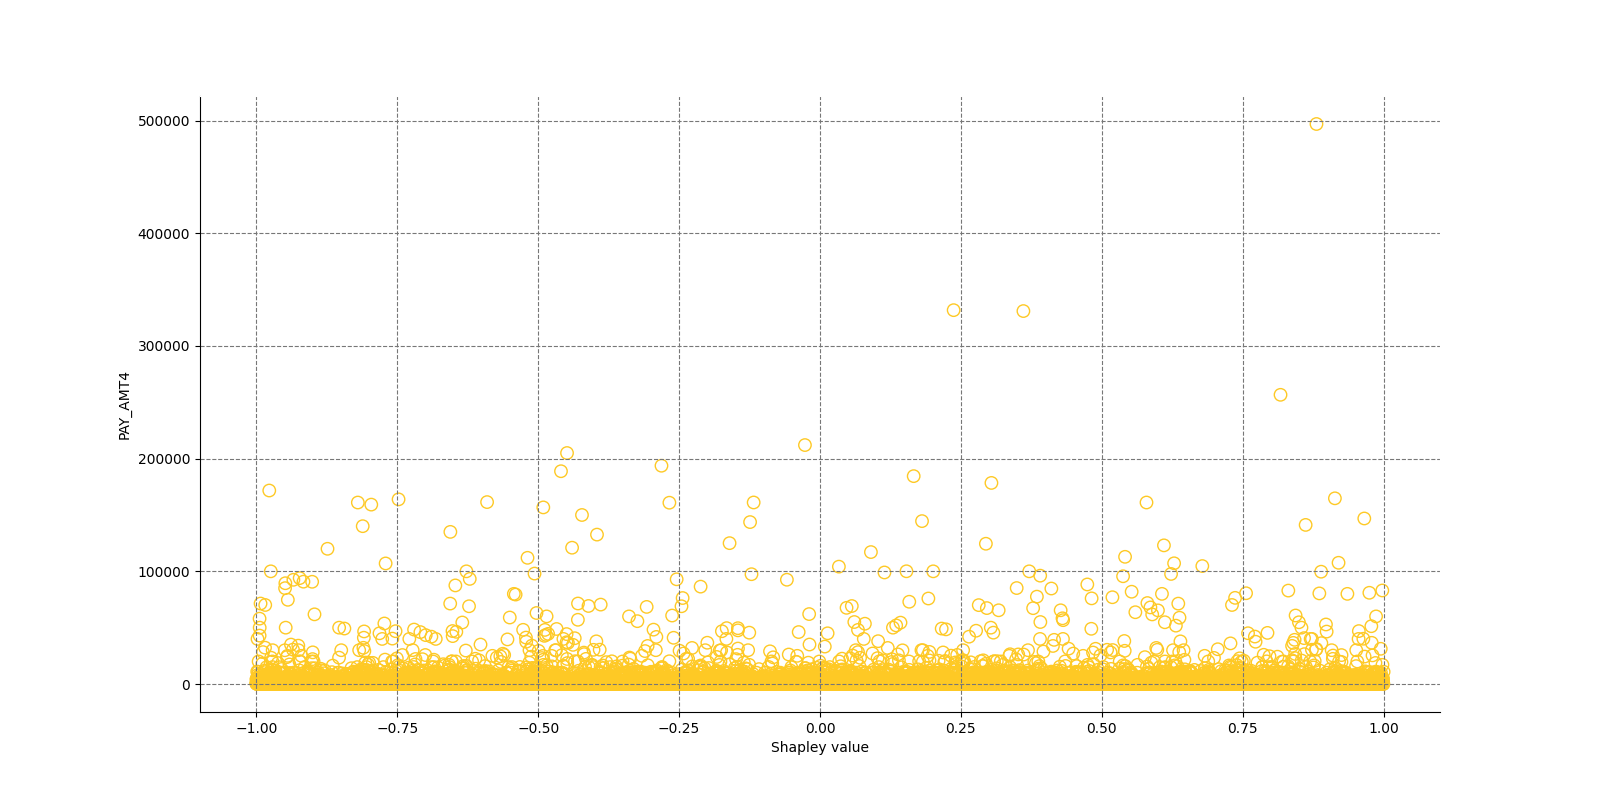
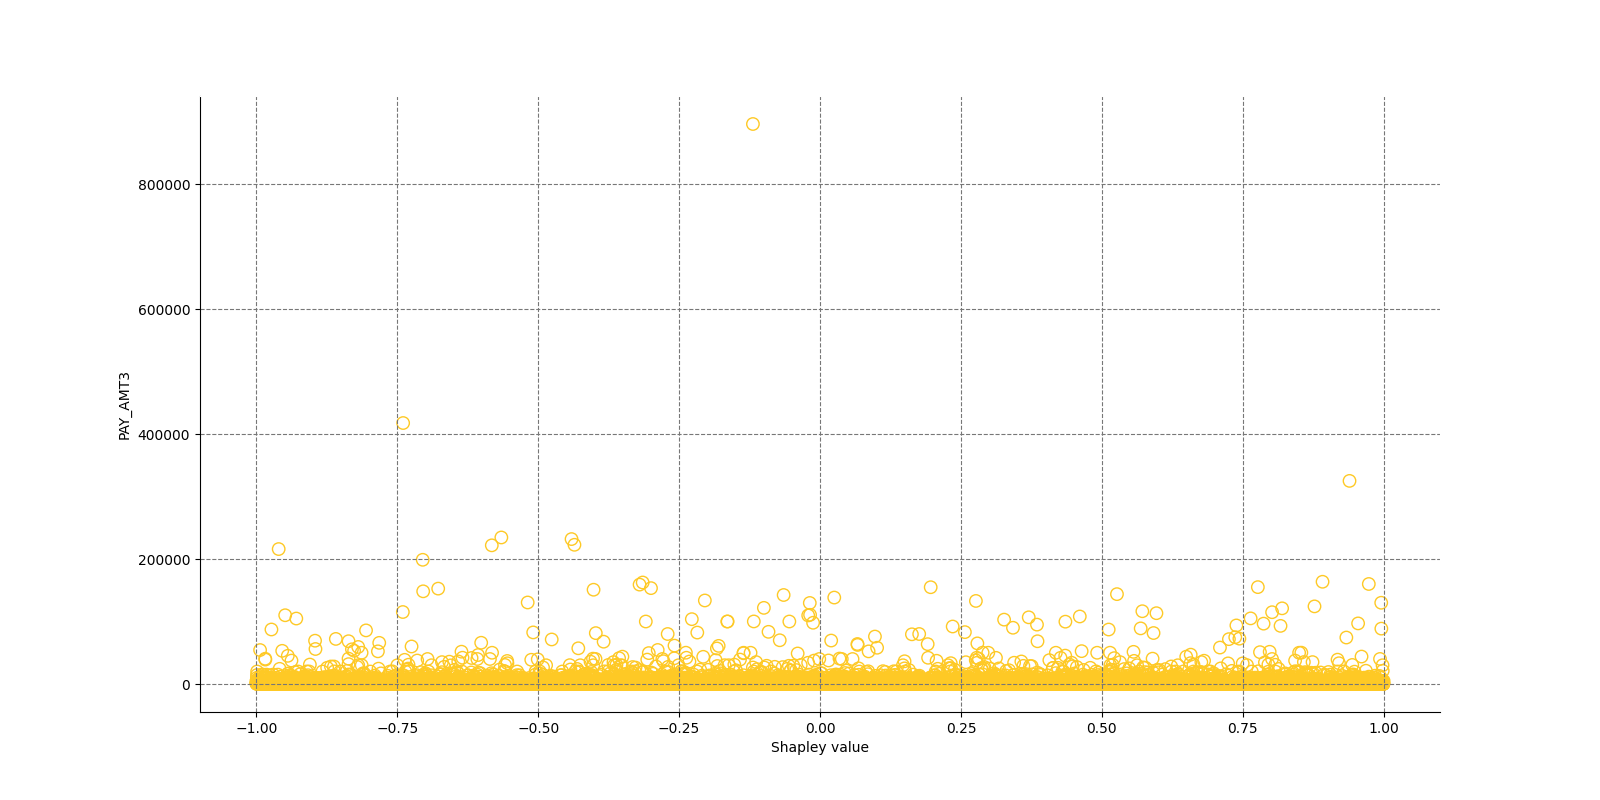
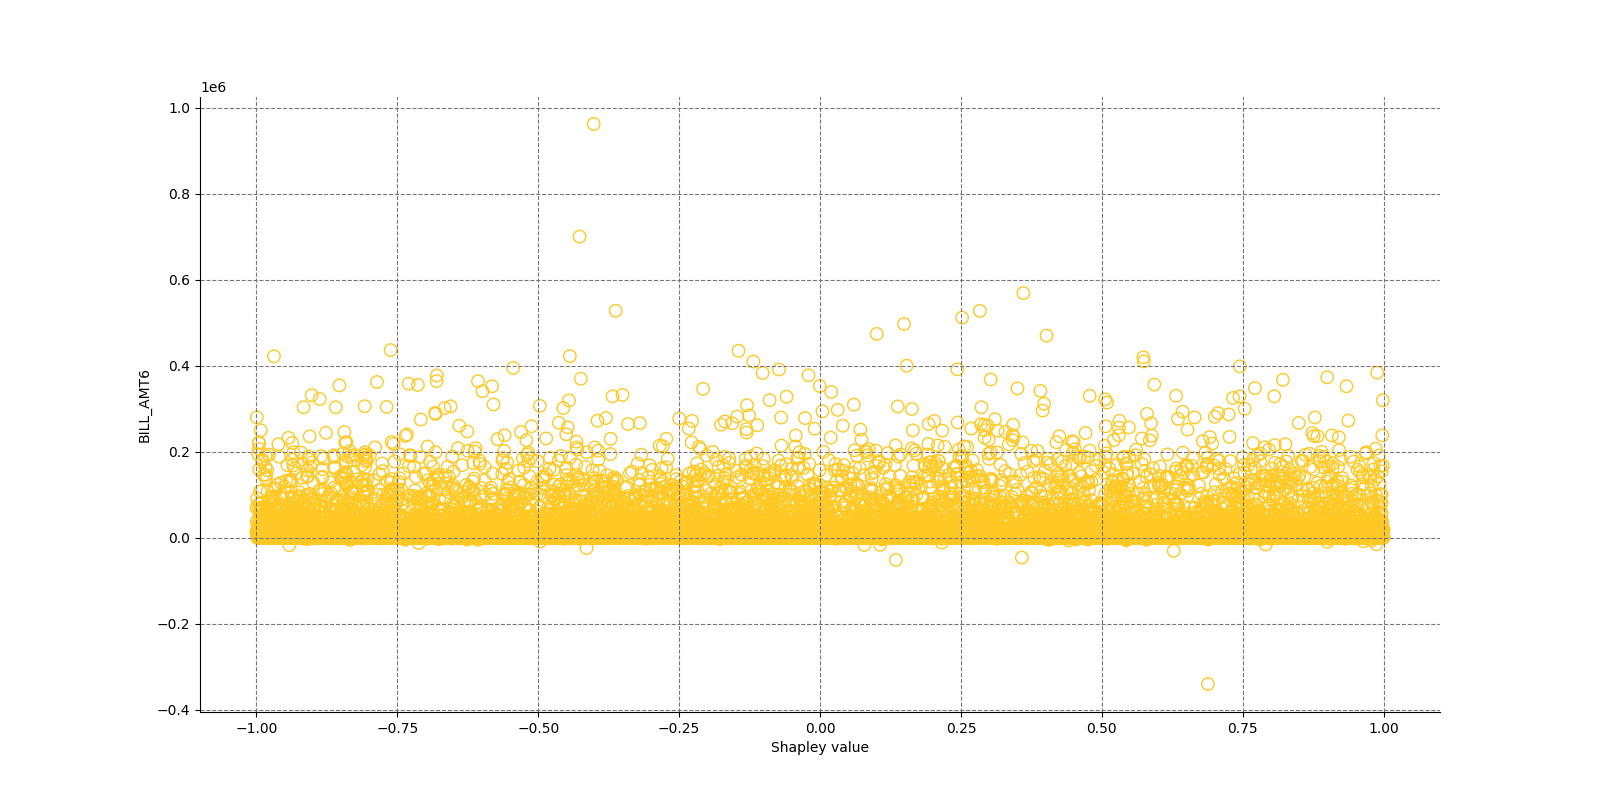
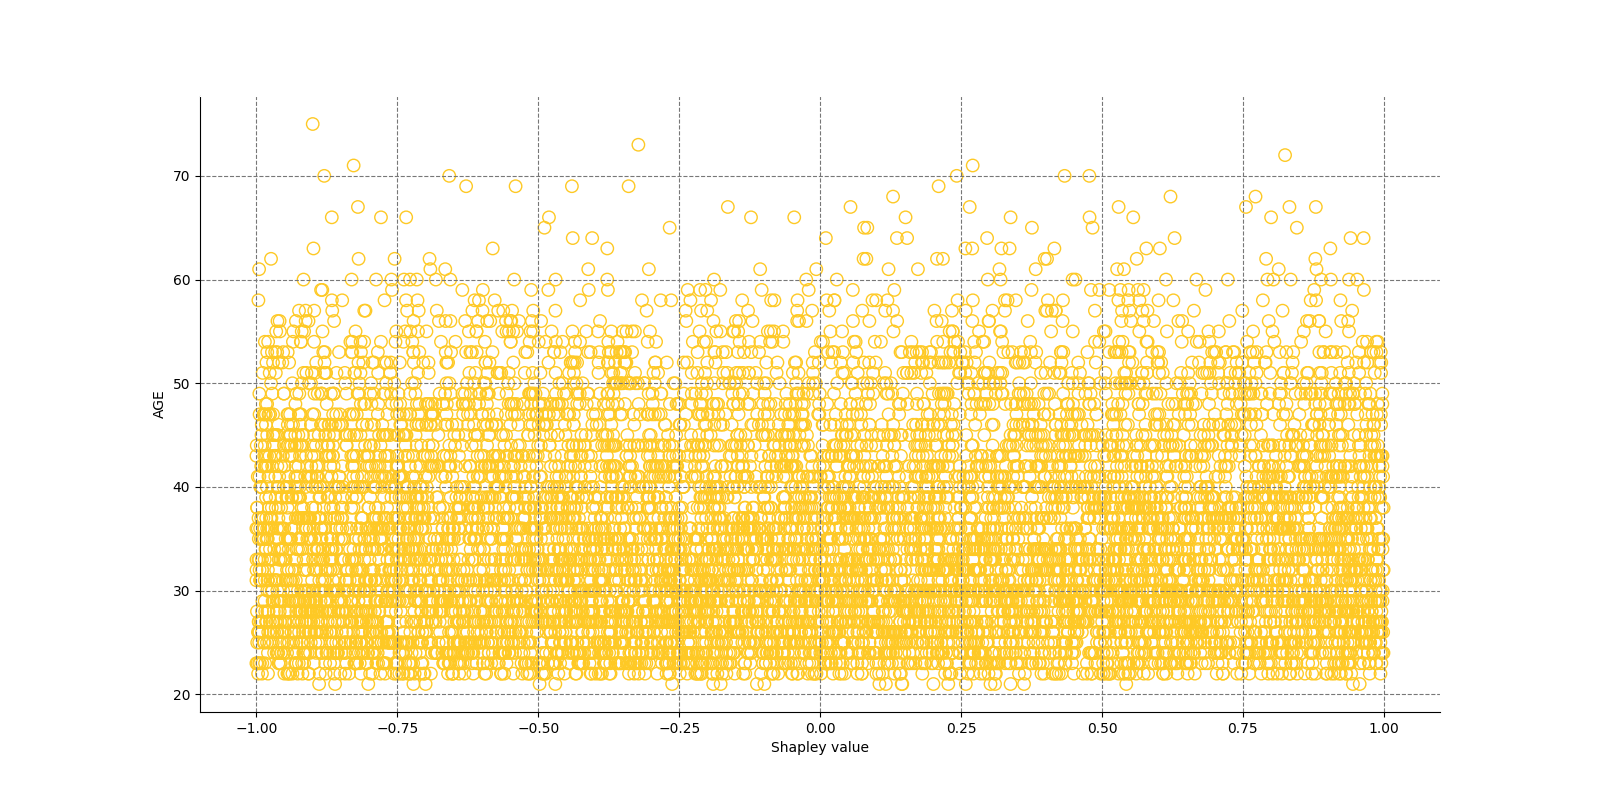
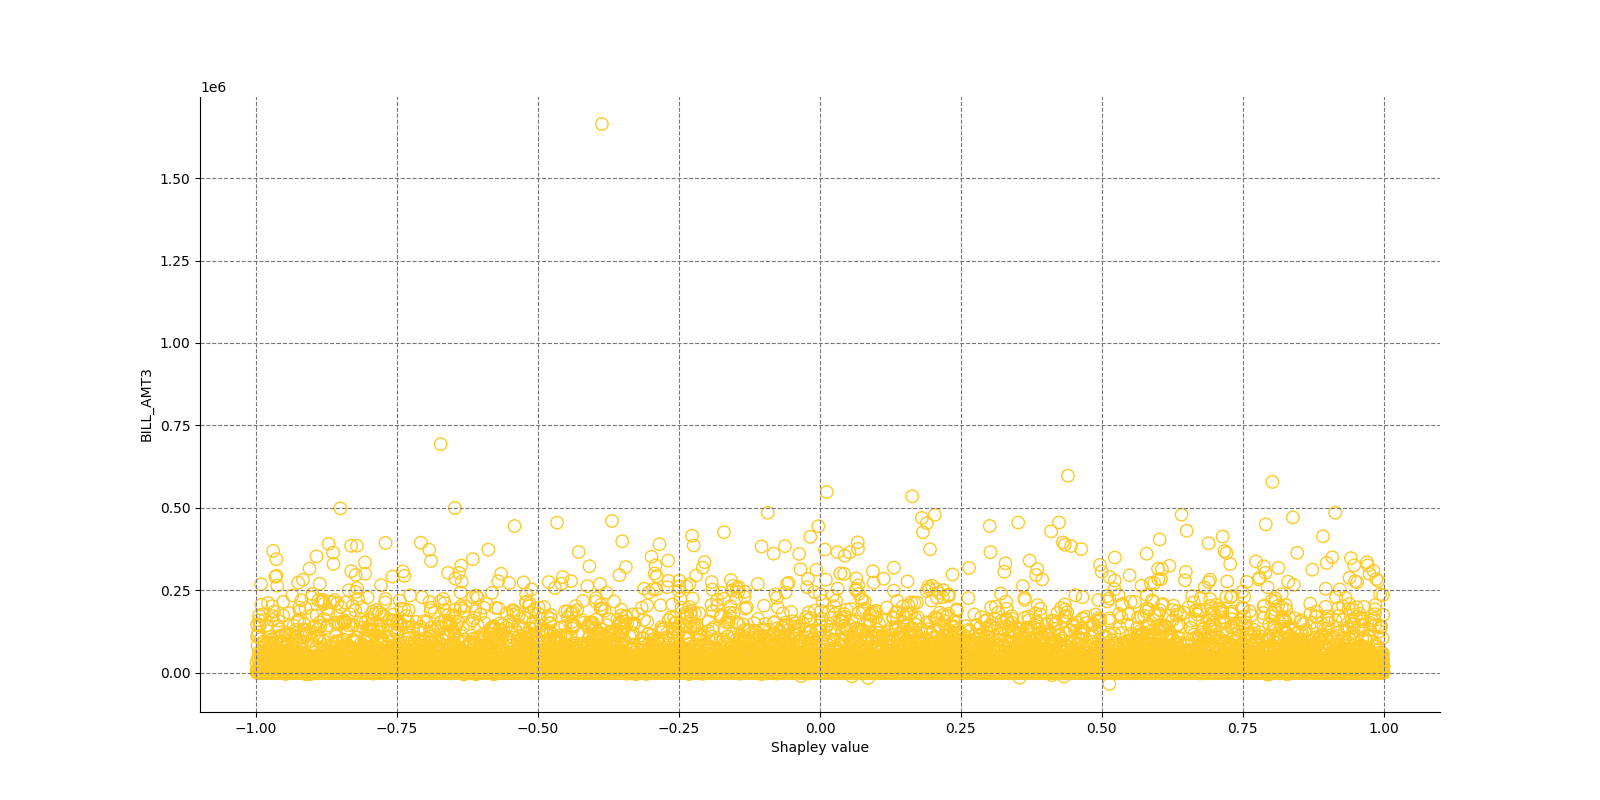
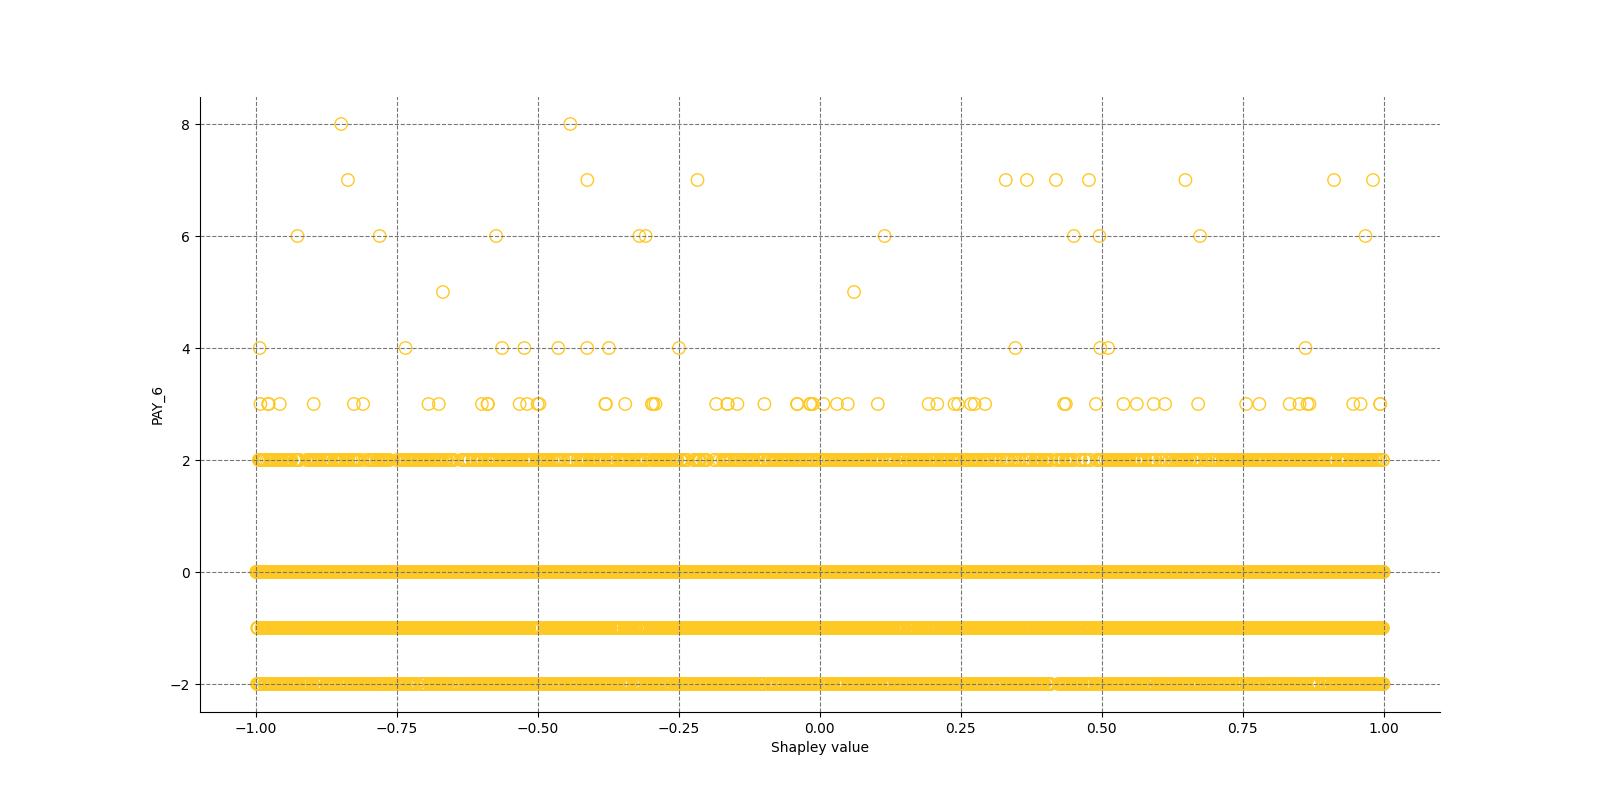
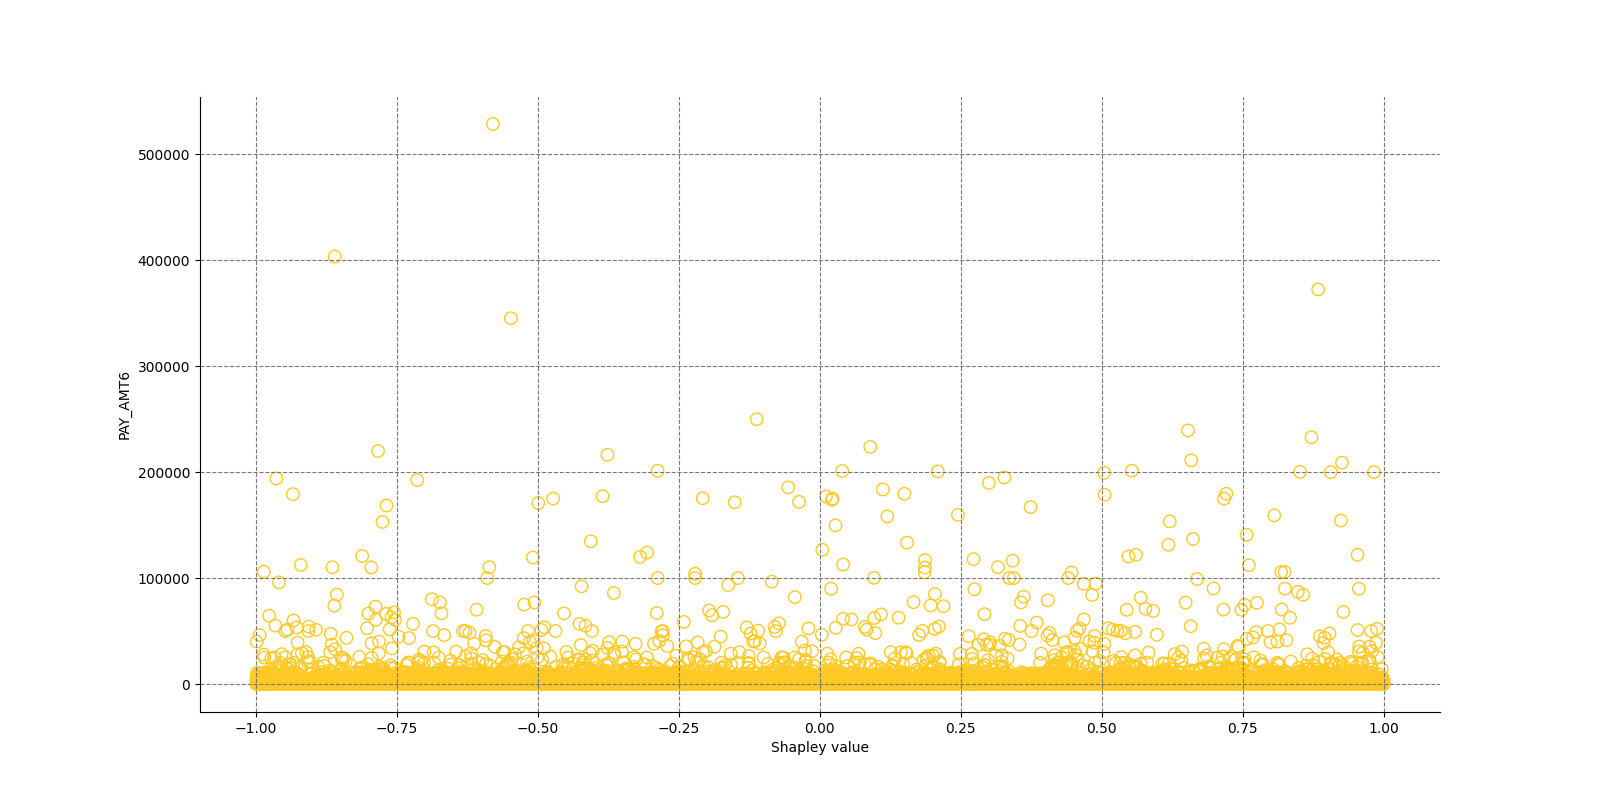
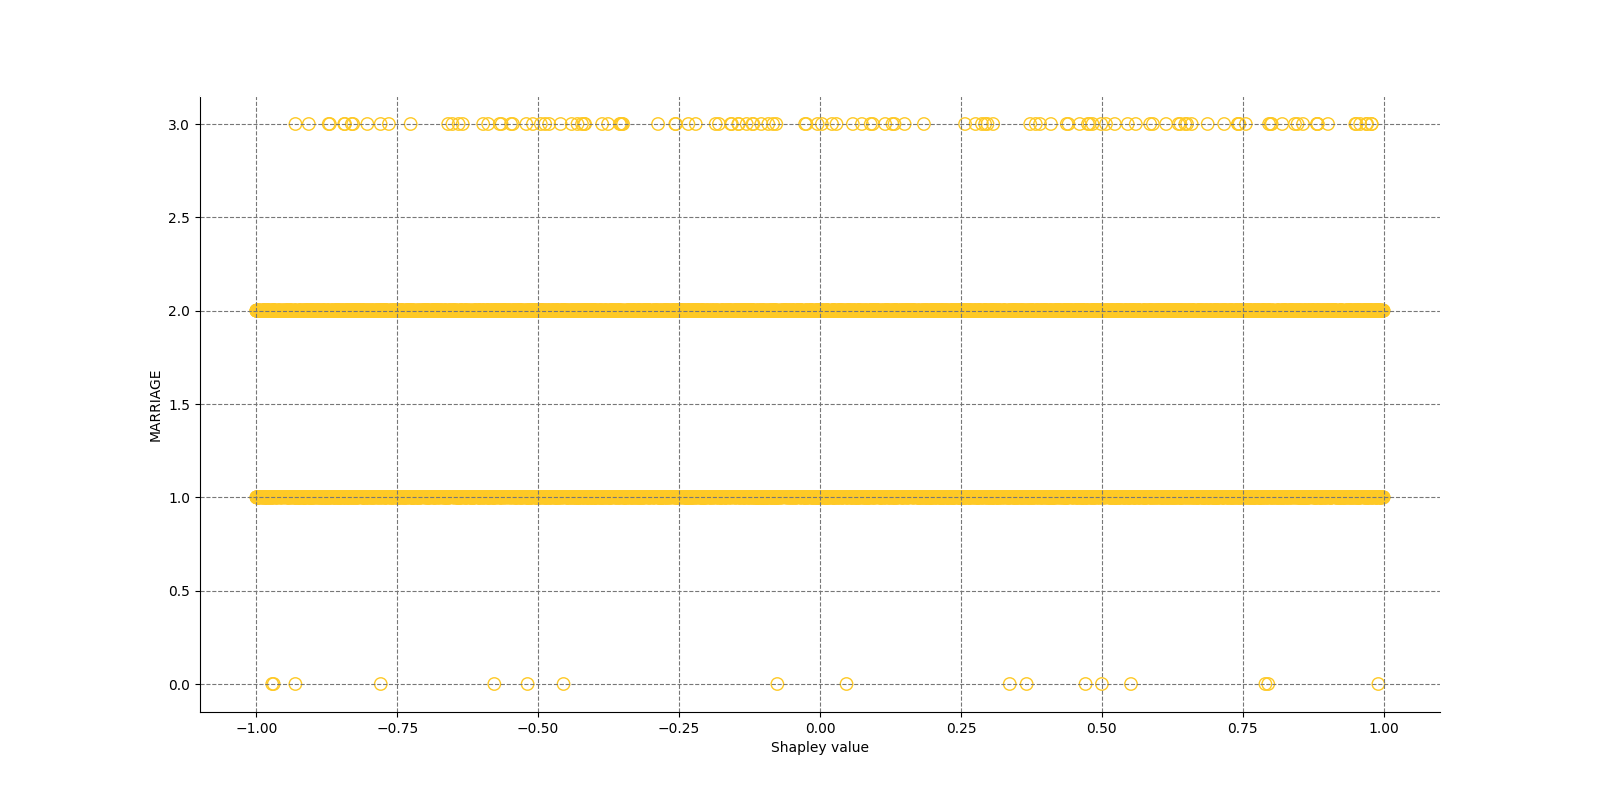
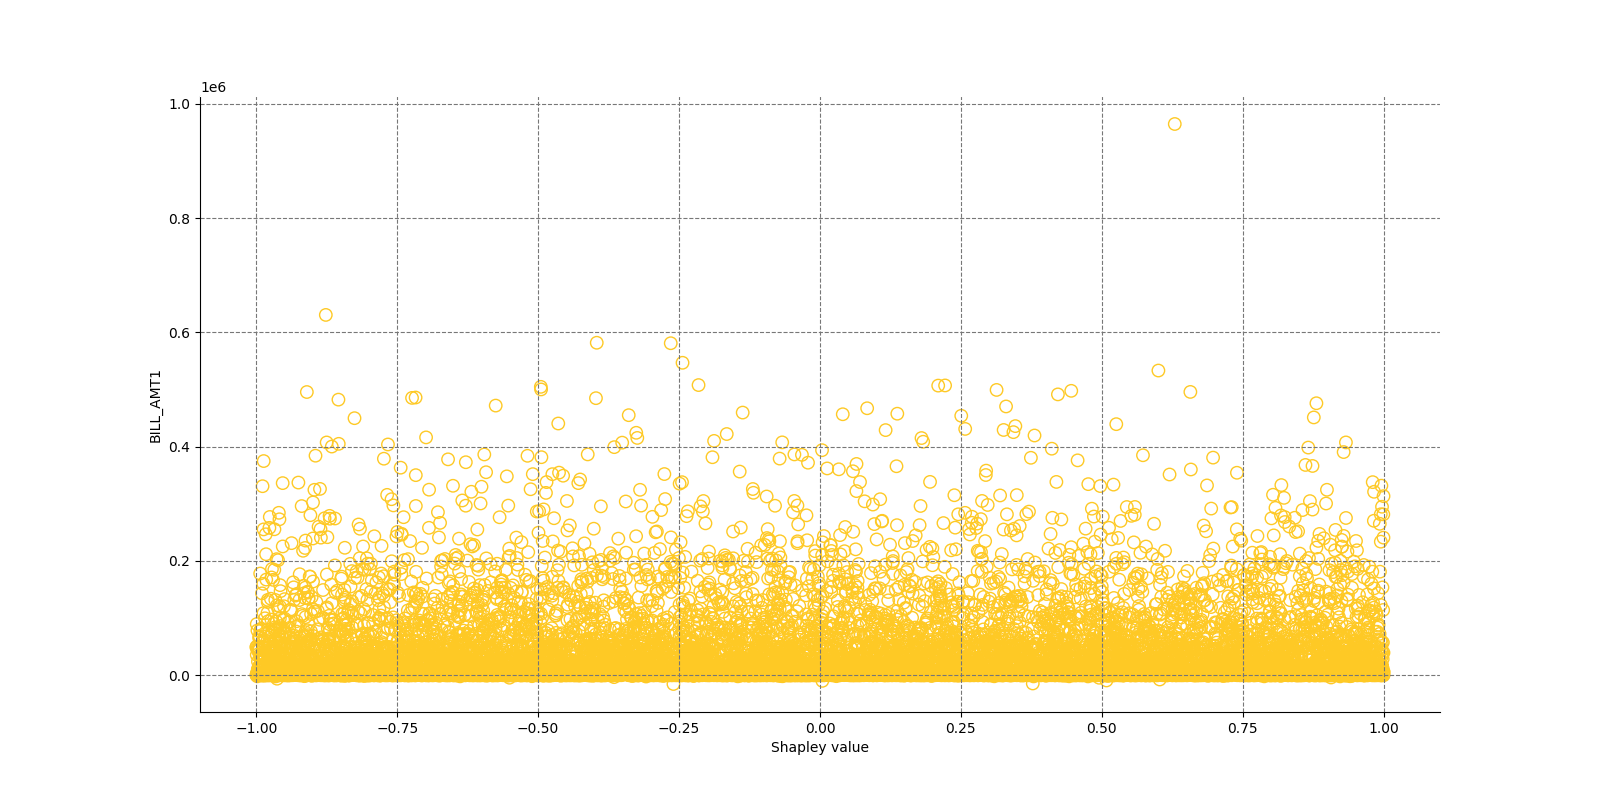
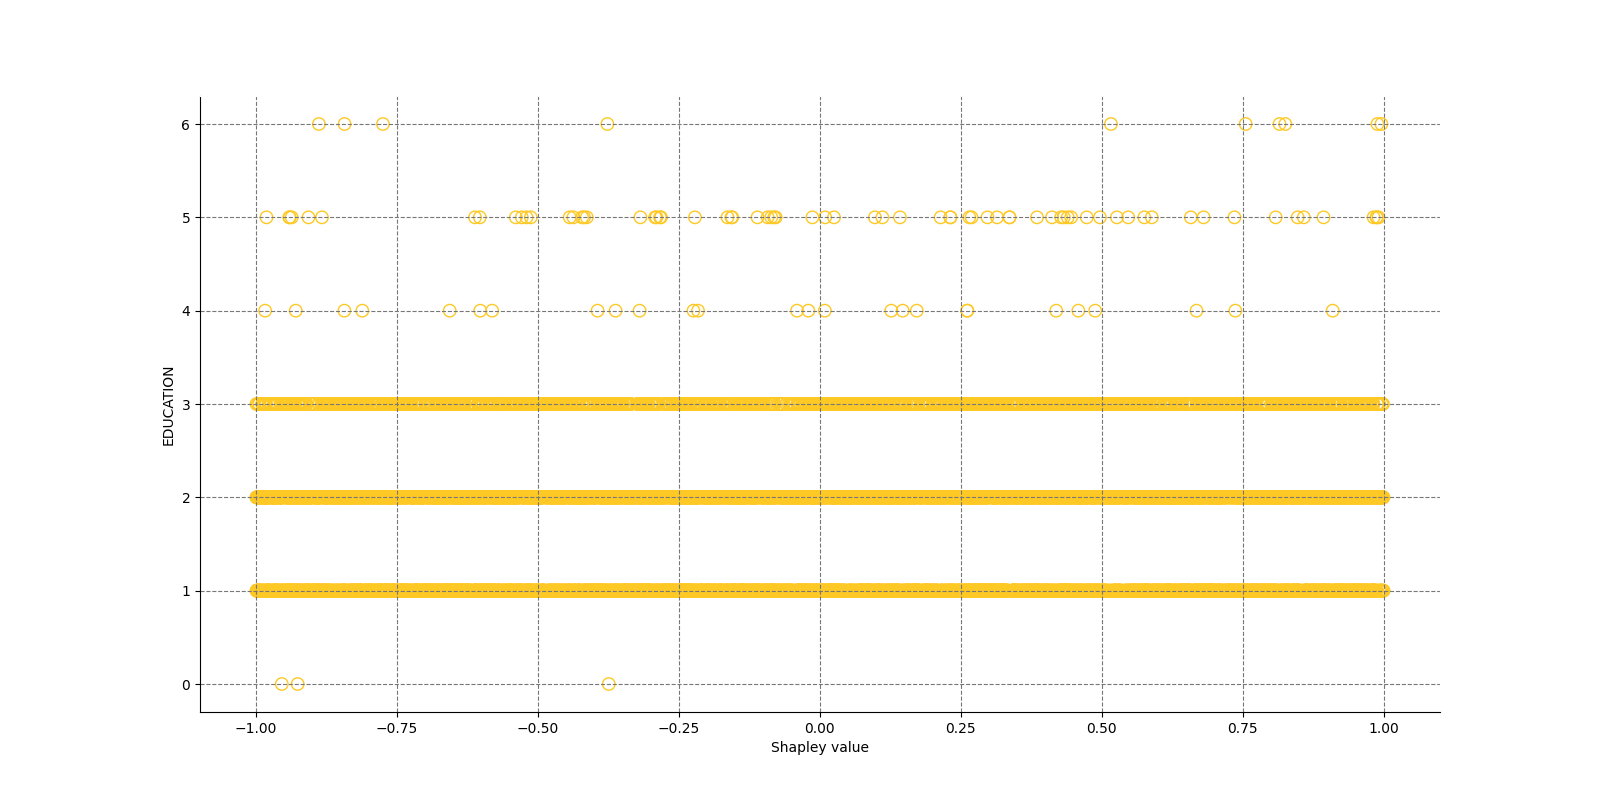
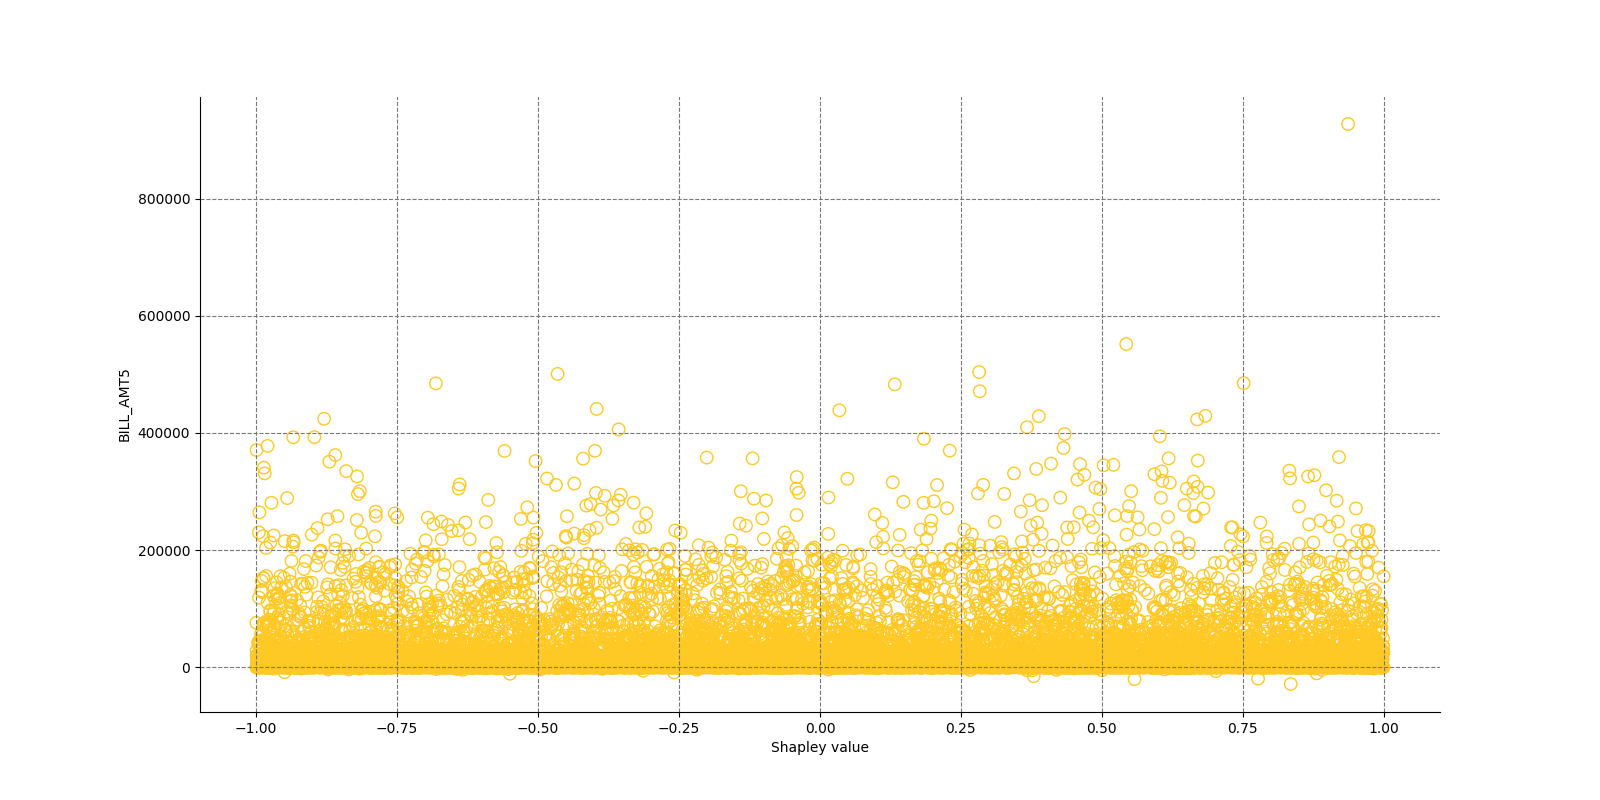
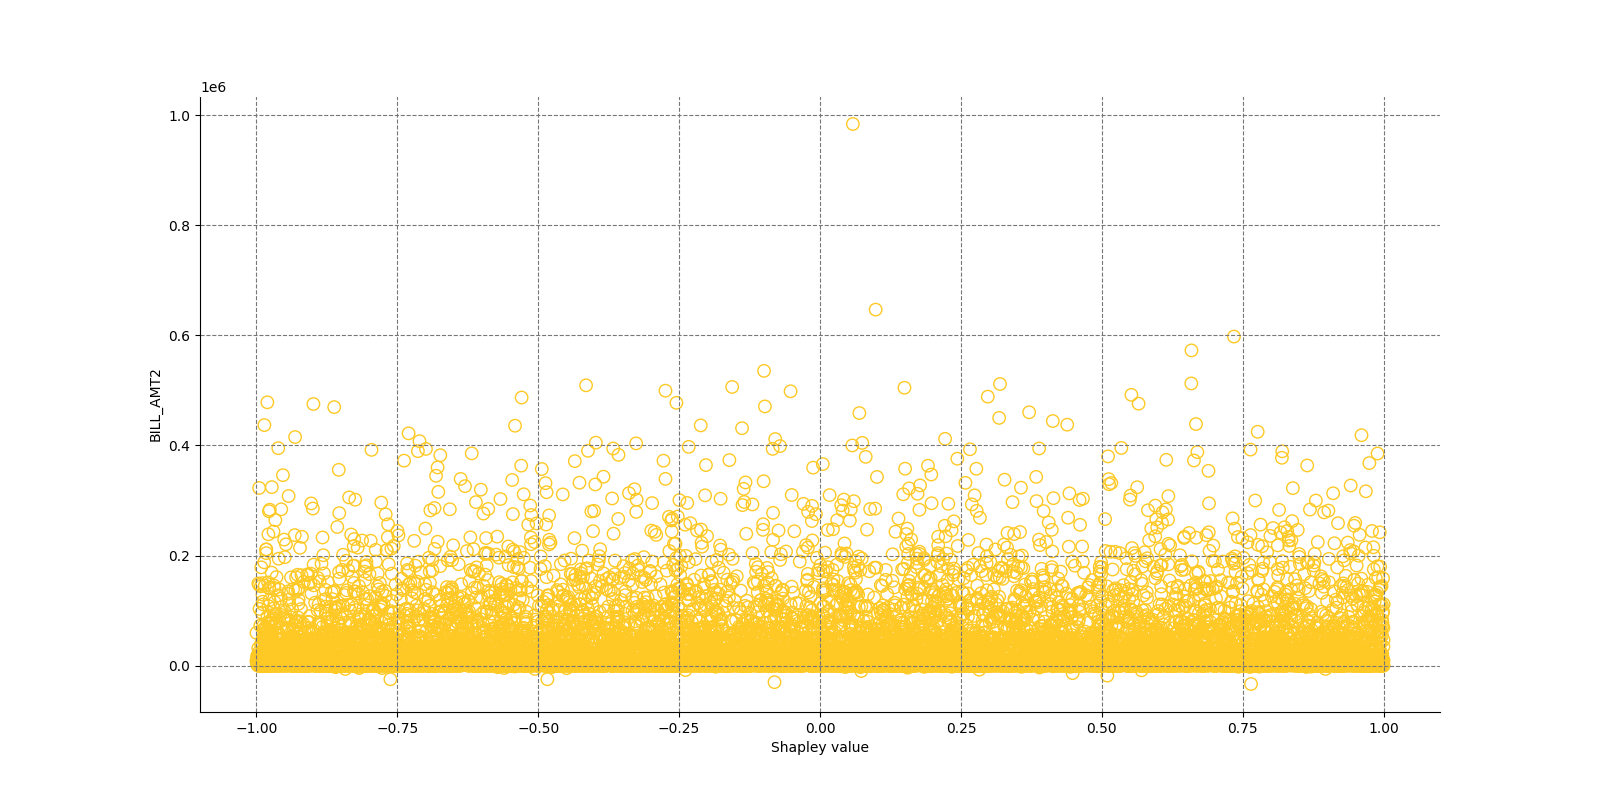
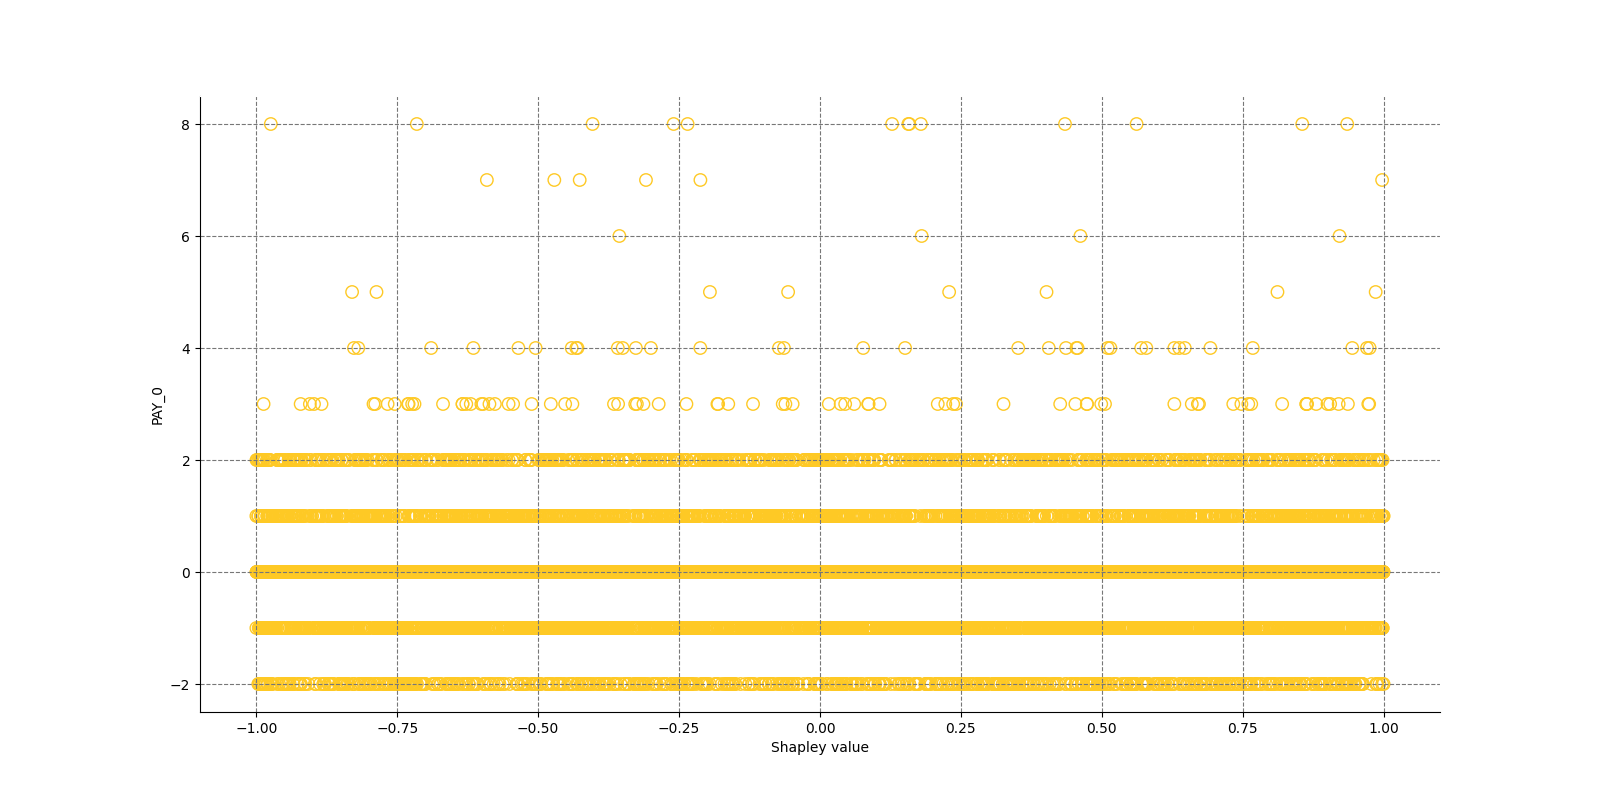
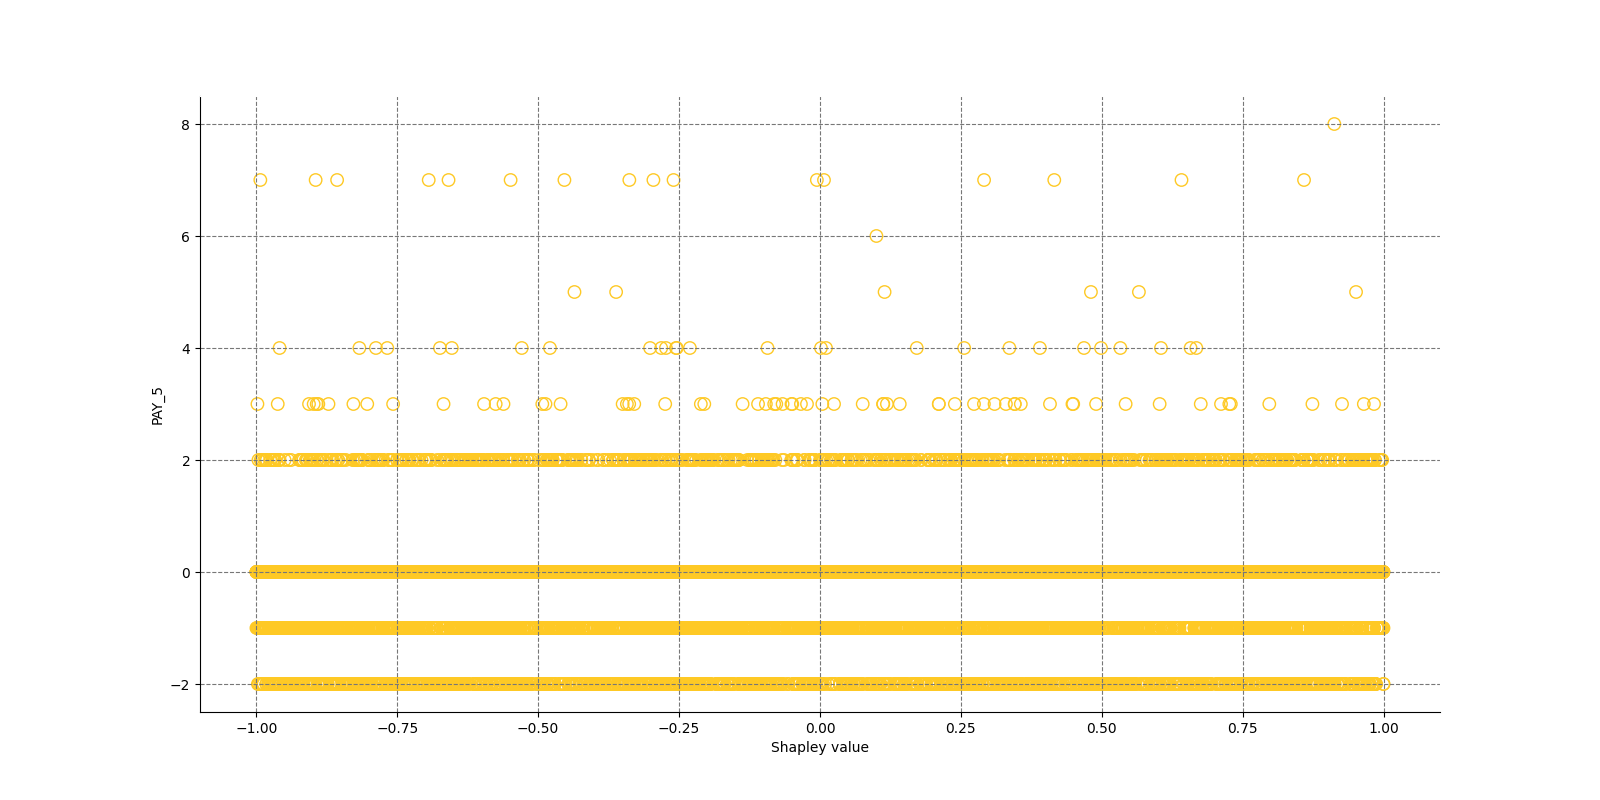
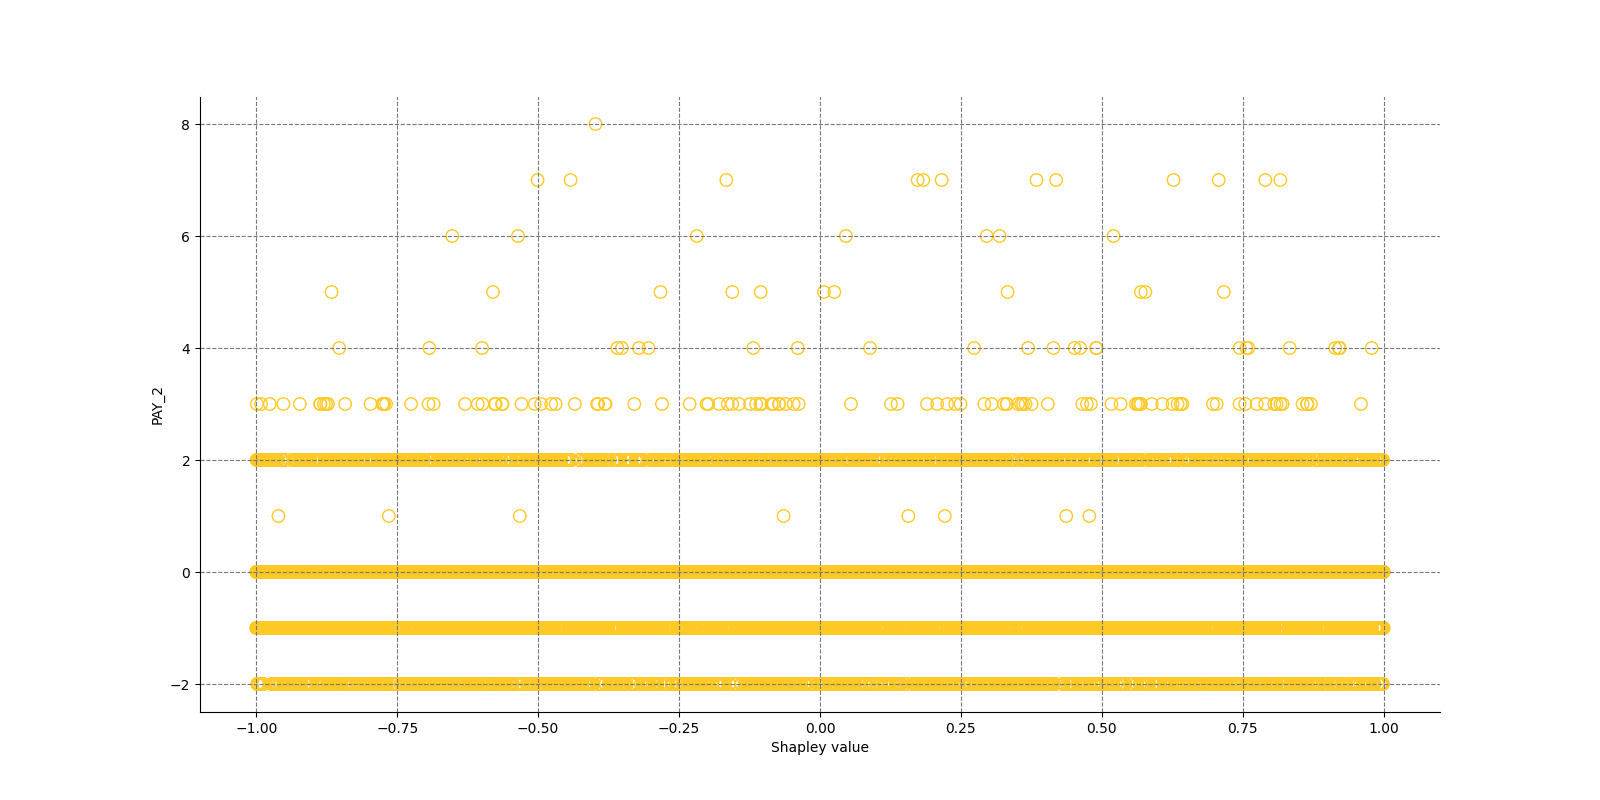
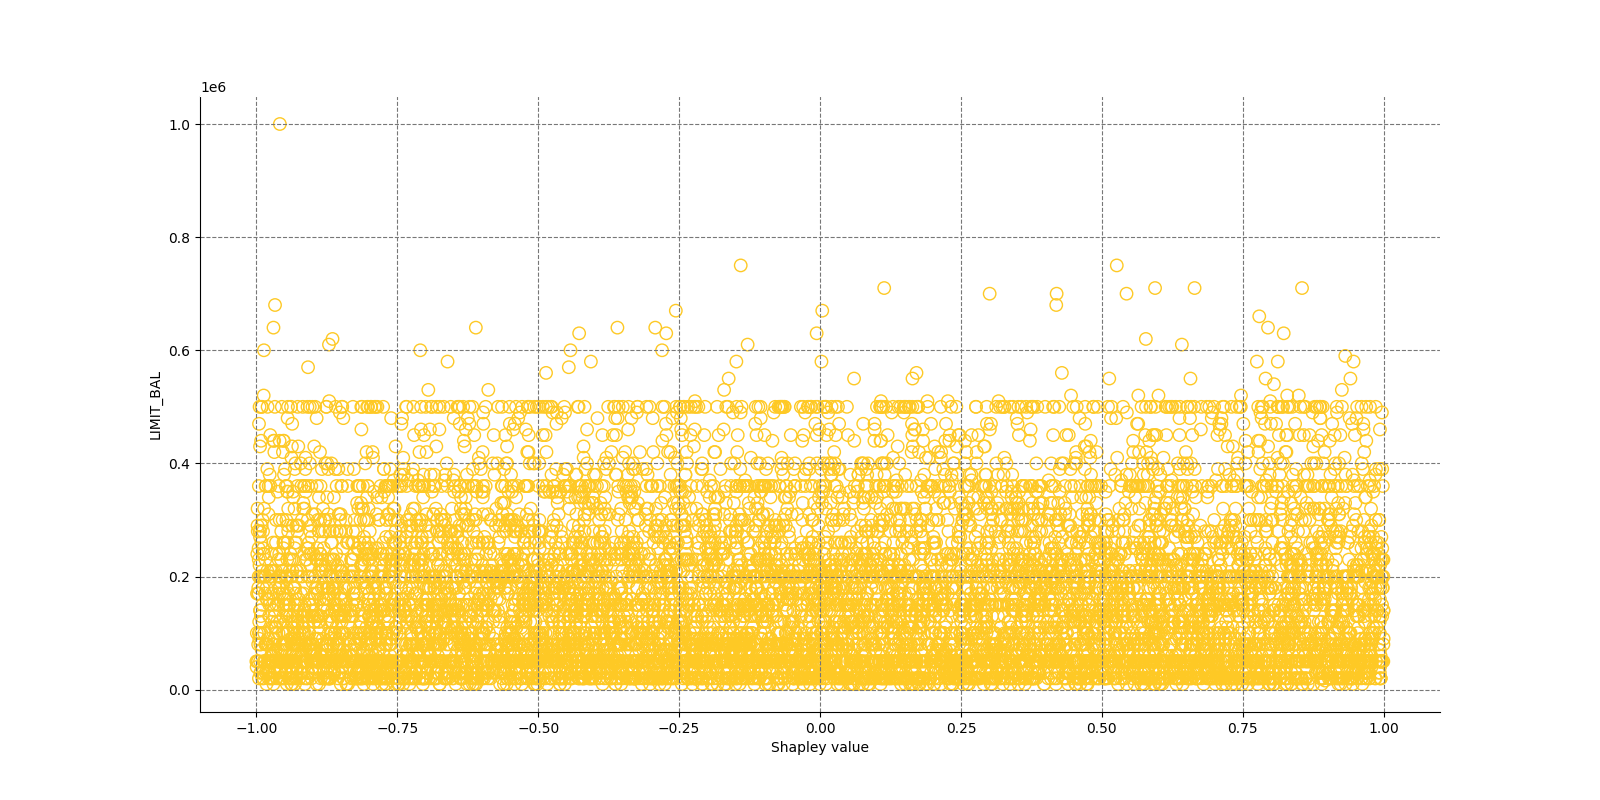
Explainer log file:Explainer: Shapley Summary Plot for Original Features (Kernel SHAP Method)
Explainer description
Shapley explanations are a technique with credible theoretical support that presents consistent global and local feature contributions.
The Shapley Summary Plot shows original features versus their local Shapley values on a sample of the dataset. Feature values are binned by Shapley values and the average normalized feature value for each bin is plotted. The legend corresponds to numeric features and maps to their normalized value - yellow is the lowest value and deep orange is the highest. You can also get a scatter plot of the actual numeric features values versus their corresponding Shapley values. Categorical features are shown in grey and do not provide an actual-value scatter plot.
Notes:
- The Shapley Summary Plot only shows original features that are used in the model.
- The dataset sample size and the number of bins can be updated in the interpretation settings.
Explanations
Global Shapley values for original features of class 'None (Regression)':
Explanations
Model explanations created by the explainer organized by explanation types with its formats (representations) identified by media types :-
Shapley Summary Plot for Original Features
global-summary-feature-importance -
Shapley Summary Plot for Original Features
global-html-fragment
Explainer parameters
Explainer was run with the following parameters:| Parameter | Value | Description | Type | Default value |
|---|---|---|---|---|
| max_features |
50
|
Maximum number of features to be shown in the plot. |
int
|
50
|
| sample_size |
20000
|
Sample size. |
int
|
20000
|
| x_shapley_resolution |
500
|
x-axis resolution (number of Shapley values bins). |
int
|
500
|
| enable_drilldown_charts |
True
|
Enable creation of per-feature Shapley/feature value scatter plots. |
bool
|
True
|
| fast_approx_contribs |
True
|
Speed up predictions with fast predictions and contributions approximations. |
bool
|
True
|
Explainer metadata
The explainer can explain model types:- regression
- binomial
- multinomial
- run-by-default
- explains-feature-behavior
- h2o-sonar
Explainer run
Explainer run details:- Status code: SUCCESS
- Progress: 100%
- Started: 2026-01-30 17:31:08 T+0100
- Duration: 12.129s
Explainer log
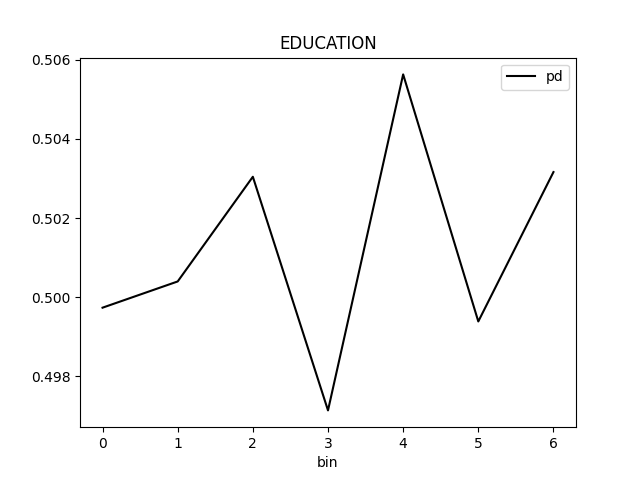
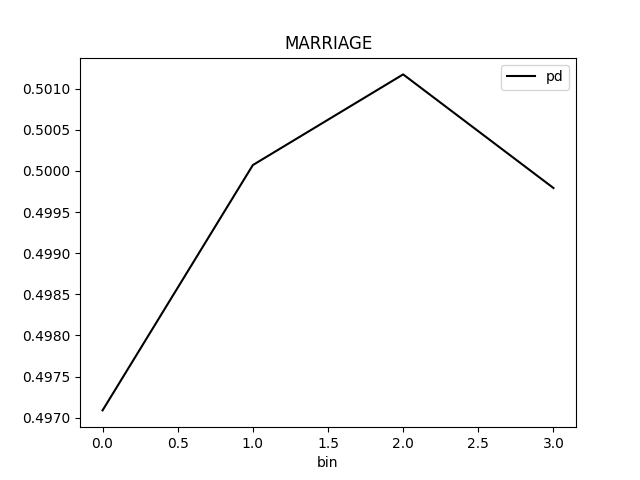
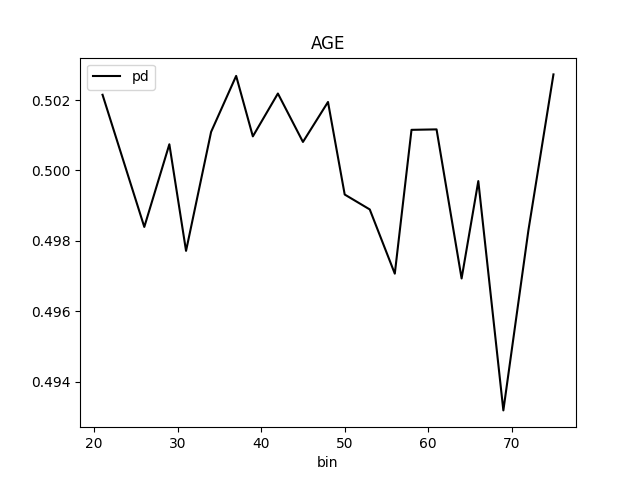
Explainer log file:Explainer: Partial Dependence Plot
Explainer description
Partial dependence plot (PDP) portrays the average prediction behavior of the model across the domain of an input variable along with +/- 1 standard deviation bands. Individual Conditional Expectations plot (ICE) displays the prediction behavior for an individual row of data when an input variable is toggled across its domain.
PD binning:
Integer feature:
- bins in numeric mode:
- bins are integers
- (at most)
grid_resolutioninteger values in between minimum and maximum of feature values - bin values are created as evenly as possible
- minimum and maximum is included in bins
(if
grid_resolutionis bigger or equal to 2)
- bins in categorical mode:
- bins are integers
- top
grid_resolutionvalues from feature values ordered by frequency (int values are converted to strings and most frequent values are used as bins)
- quantile bins in numeric mode:
- bins are integers
- bin values are created with the aim that there will be the same number of observations per bin
- q-quantile used to created
qbins whereqis specified by PD parameter
- quantile bins in categorical mode:
- not supported
Float feature:
- bins in numeric mode:
- bins are floats
grid_resolutionfloat values in between minimum and maximum of feature values- bin values are created as evenly as possible
- minimum and maximum is included in bins
(if
grid_resolutionis bigger or equal to 2)
- bins in categorical mode:
- bins are floats
- top
grid_resolutionvalues from feature values ordered by frequency (float values are converted to strings and most frequent values are used as bins)
- quantile bins in numeric mode:
- bins are floats
- bin values are created with the aim that there will be the same number of observations per bin
- q-quantile used to created
qbins whereqis specified by PD parameter
- quantile bins in categorical mode:
- not supported
String feature:
- bins in numeric mode:
- not supported
- bins in categorical mode:
- bins are strings
- top
grid_resolutionvalues from feature values ordered by frequency
- quantile bins:
- not supported
Date/datetime feature:
- bins in numeric mode:
- bins are dates
grid_resolutiondate values in between minimum and maximum of feature values- bin values are created as evenly as possible:
- dates are parsed and converted to epoch timestamps i.e integers
- bins are created as in case of numeric integer binning
- integer bins are converted back to original date format
- minimum and maximum is included in bins
(if
grid_resolutionis bigger or equal to 2)
- bins in categorical mode:
- bins are dates
- top
grid_resolutionvalues from feature values ordered by frequency (dates are handled as opaque strings and most frequent values are used as bins)
- quantile bins:
- not supported
PD out of range binning:
Integer feature:
- OOR bins in numeric mode:
- OOR bins are integers
- (at most)
oor_grid_resolutioninteger values are added below minimum and above maximum - bin values are created by adding/substracting rounded standard deviation
(of feature values) above and below maximum and minimum
oor_grid_resolutiontimes- 1 used used if rounded standard deviation would be 0
- if feature is of unsigned integer type, then bins below 0
are not created
- if rounded standard deviation and/or
oor_grid_resolutionis so high that it would cause lower OOR bins to be negative numbers, then standard deviation of size 1 is tried instead
- if rounded standard deviation and/or
- OOR bins in categorical mode:
- same as numeric mode
Float feature:
- OOR bins in numeric mode:
- OOR bins are floats
oor_grid_resolutionfloat values are added below minimum and above maximum- bin values are created by adding/substracting standard deviation
(of feature values) above and below maximum and minimum
oor_grid_resolutiontimes
- OOR bins in categorical mode:
- same as numeric mode
String feature:
- bins in numeric mode:
- not supported
- bins in categorical mode:
- OOR bins are strings
- value
UNSEENis added as OOR bin
Date feature:
- bins in numeric mode:
- not supported
- bins in categorical mode:
- OOR bins are strings
- value
UNSEENis added as OOR bin
Explanations
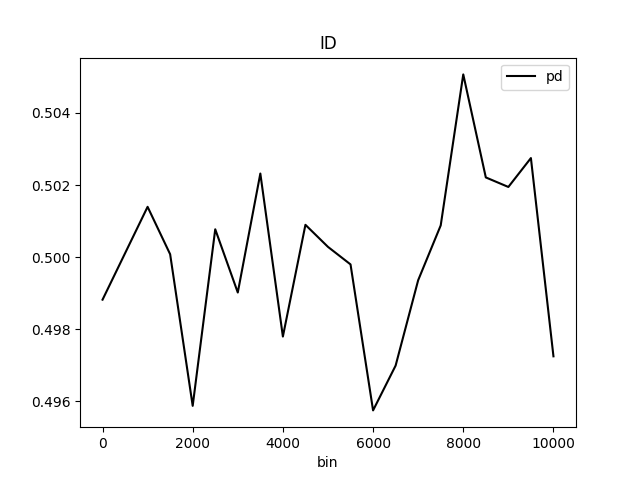
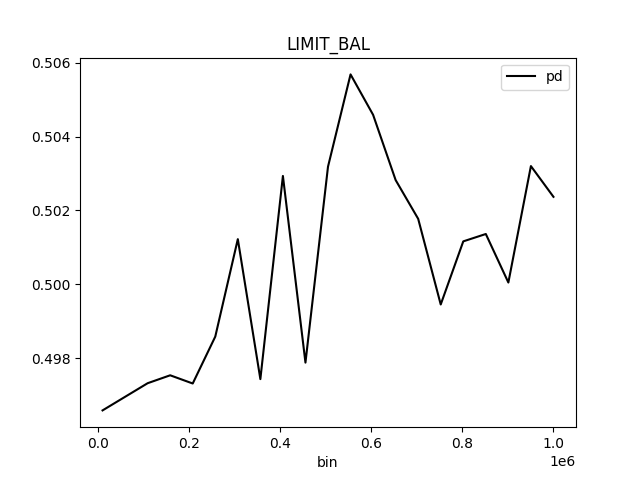
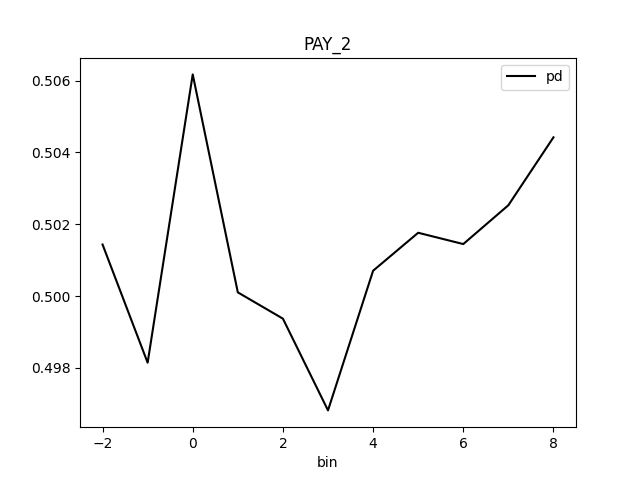
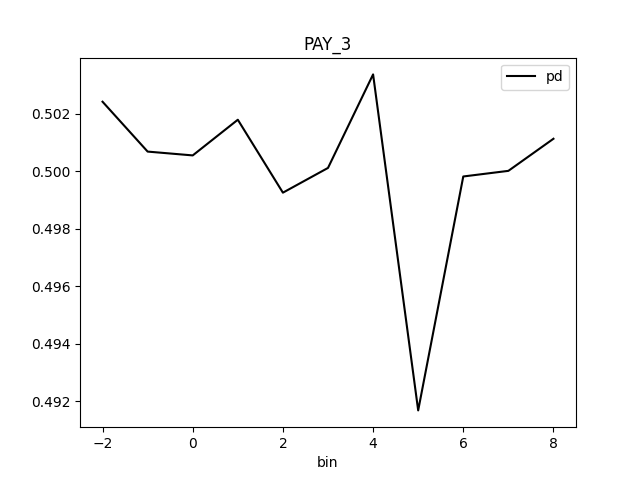
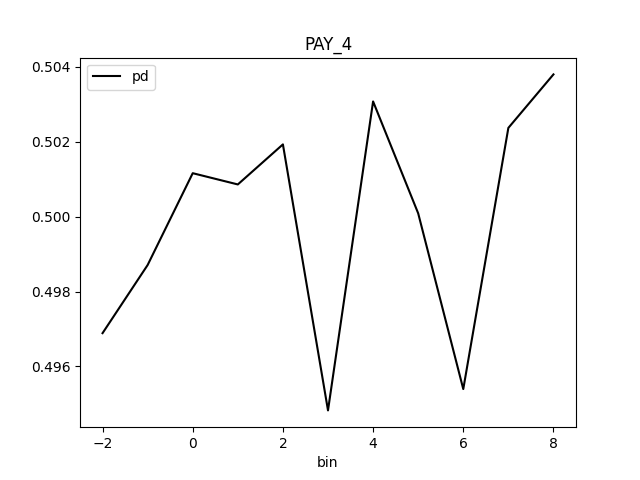
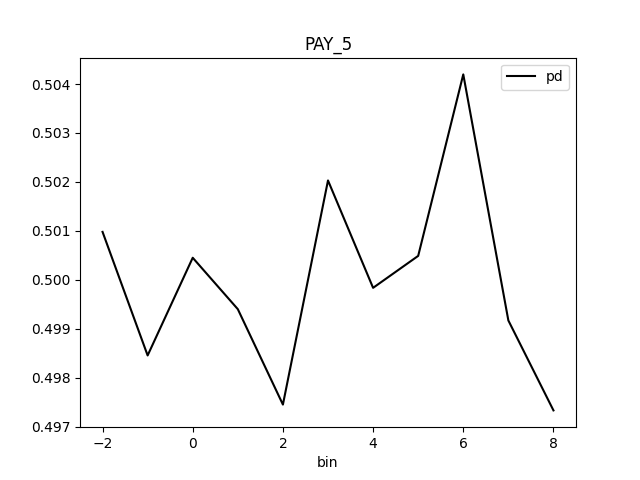
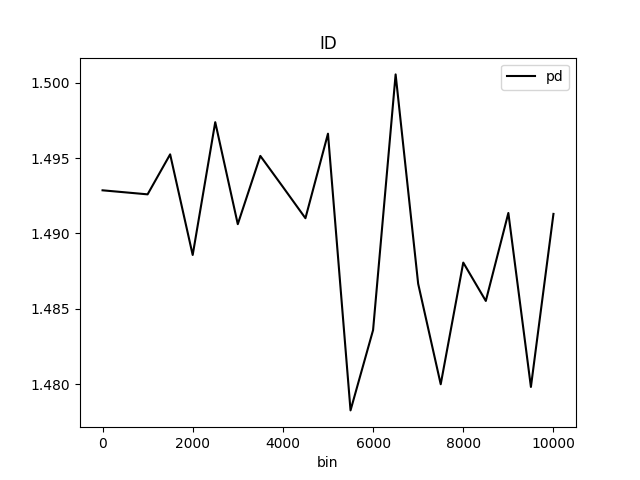
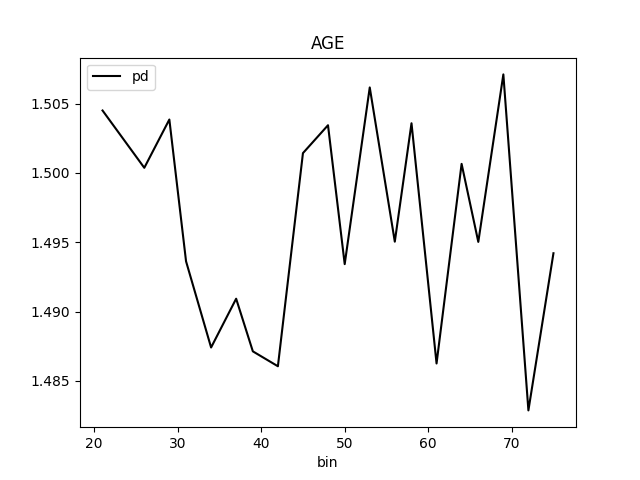
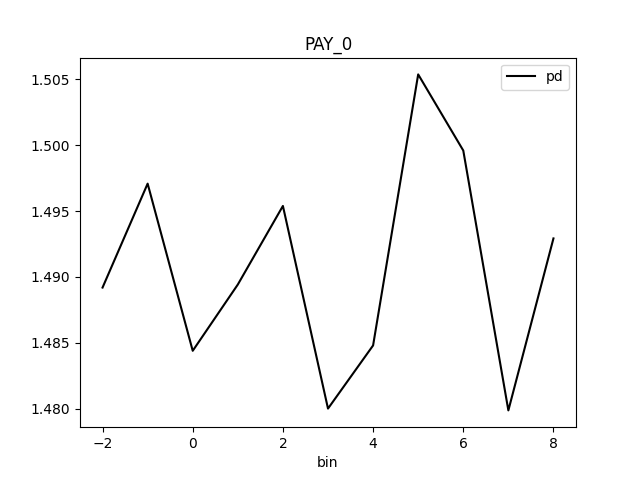
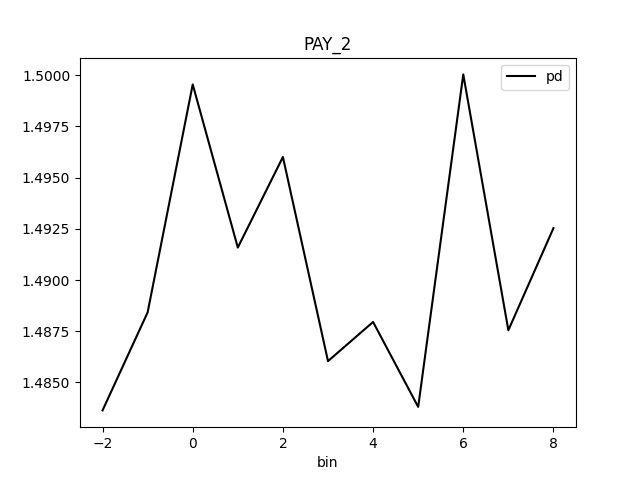
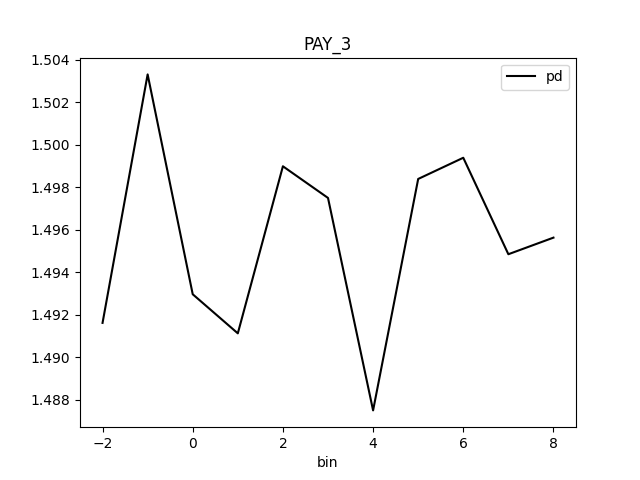
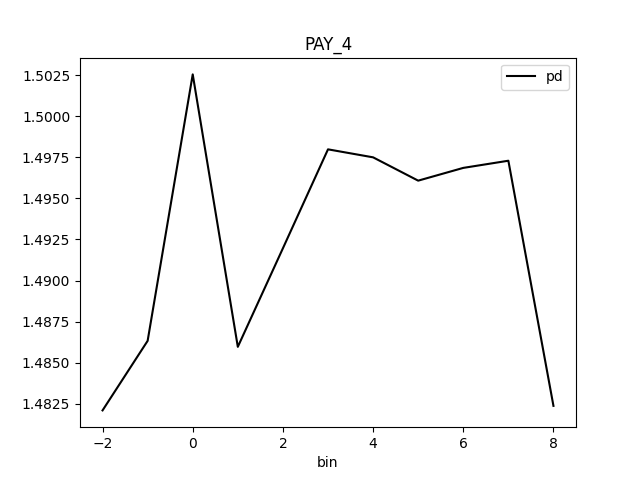
Partial Dependence Plot for the feature 'ID' and class 'None (Regression)':
Explanations
Model explanations created by the explainer organized by explanation types with its formats (representations) identified by media types :-
Partial Dependence Plot (PDP)
global-partial-dependence -
Individual Conditional Expectations (ICE)
local-individual-conditional-explanation -
Partial Dependence Plot (PDP)
global-html-fragment
Explainer parameters
Explainer was run with the following parameters:| Parameter | Value | Description | Type | Default value |
|---|---|---|---|---|
| sample_size |
25000
|
Sample size for Partial Dependence Plot. |
int
|
25000
|
| max_features |
10
|
Partial Dependence Plot number of features (to see all features used by model set to -1). |
int
|
10
|
| features |
None
|
Partial Dependence Plot feature list. |
list
|
None
|
| oor_grid_resolution |
0
|
Partial Dependence Plot number of out of range bins. |
int
|
0
|
| quantile-bin-grid-resolution |
0
|
Partial Dependence Plot quantile binning (total quantile points used to create bins). |
int
|
0
|
| grid_resolution |
20
|
Partial Dependence Plot observations per bin (number of equally spaced points used to create bins). |
int
|
20
|
| center |
False
|
Center Partial Dependence Plot using ICE centered at 0. |
bool
|
False
|
| sort_bins |
True
|
Ensure bin values sorting. |
bool
|
True
|
| histograms |
True
|
Enable histograms. |
bool
|
True
|
| quantile-bins |
|
Per-feature quantile binning (Example: if choosing features F1 and F2, this parameter is '{"F1": 2,"F2": 5}'. Note, you can set all features to use the same quantile binning with the `Partial Dependence Plot quantile binning` parameter and then adjust the quantile binning for a subset of PDP features with this parameter). |
str
|
|
| numcat_num_chart |
True
|
Unique feature values count driven Partial Dependence Plot binning and chart selection. |
bool
|
True
|
| numcat_threshold |
11
|
Threshold for Partial Dependence Plot binning and chart selection (<=threshold categorical, >threshold numeric). |
int
|
11
|
| debug_residuals |
False
|
Debug model residuals. |
bool
|
False
|
Explainer metadata
The explainer can explain model types:- regression
- binomial
- multinomial
- run-by-default
- can-add-feature
- explains-feature-behavior
- h2o-sonar
Explainer run
Explainer run details:- Status code: SUCCESS
- Progress: 100%
- Started: 2026-01-30 17:31:20 T+0100
- Duration: 1.342s
Explainer log
Explainer log file:Explainer: Residual Partial Dependence Plot
Problems
Explainer identified the following problems:
| Severity | Type | Problem | Suggested actions | Explainer | Resources |
|---|---|---|---|---|---|
| MEDIUM | bias | The residual partial dependence plot of feature 'LIMIT_BAL' indicates the highest interaction of this feature with the error (residual abs(max-min) = 0.03134083655380704) from all the features used by the model (or features configured for PD calculation) | Verify that feature `LIMIT_BAL' error interaction does not indicate a model bias or other problem. | Residual Partial Dependence Plot | PartialDependenceExplanation / application/json |
Explainer description
The residual partial dependence plot (PDP) indicates which variables interact most with the error. Residuals are transformed differences between observed and predicted values: the square of the difference between observed and predicted values is used in case of regression problems; -1 * log(p) is used in case of classification problems. The residual partial dependence is created using normal partial dependence algorithm, while instead of prediction is used the residual. Individual Conditional Expectations plot (ICE) displays the interaction with error for an individual row of data when an input variable is toggled across its domain.
Explanations
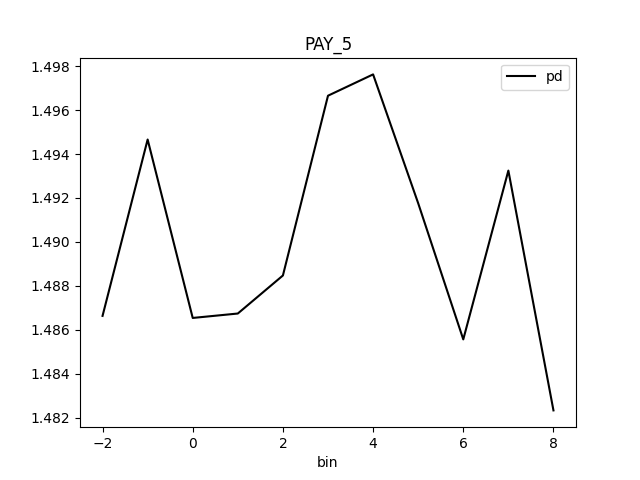
Partial Dependence Plot for the feature 'ID' and class 'None (Regression)':
Explanations
Model explanations created by the explainer organized by explanation types with its formats (representations) identified by media types :-
Residual Partial Dependence Plot
global-partial-dependence -
Residual Individual Conditional Expectations (ICE)
local-individual-conditional-explanation -
Residual Partial Dependence Plot
global-html-fragment
Explainer parameters
Explainer was run with the following parameters:| Parameter | Value | Description | Type | Default value |
|---|---|---|---|---|
| sample_size |
25000
|
Sample size for Partial Dependence Plot. |
int
|
25000
|
| max_features |
10
|
Partial Dependence Plot number of features (to see all features used by model set to -1). |
int
|
10
|
| features |
None
|
Partial Dependence Plot feature list. |
list
|
None
|
| oor_grid_resolution |
0
|
Partial Dependence Plot number of out of range bins. |
int
|
0
|
| quantile-bin-grid-resolution |
0
|
Partial Dependence Plot quantile binning (total quantile points used to create bins). |
int
|
0
|
| grid_resolution |
20
|
Partial Dependence Plot observations per bin (number of equally spaced points used to create bins). |
int
|
20
|
| center |
False
|
Center Partial Dependence Plot using ICE centered at 0. |
bool
|
False
|
| sort_bins |
True
|
Ensure bin values sorting. |
bool
|
True
|
| histograms |
True
|
Enable histograms. |
bool
|
True
|
| quantile-bins |
|
Per-feature quantile binning (Example: if choosing features F1 and F2, this parameter is '{"F1": 2,"F2": 5}'. Note, you can set all features to use the same quantile binning with the `Partial Dependence Plot quantile binning` parameter and then adjust the quantile binning for a subset of PDP features with this parameter). |
str
|
|
| numcat_num_chart |
True
|
Unique feature values count driven Partial Dependence Plot binning and chart selection. |
bool
|
True
|
| numcat_threshold |
11
|
Threshold for Partial Dependence Plot binning and chart selection (<=threshold categorical, >threshold numeric). |
int
|
11
|
| debug_residuals |
True
|
|
|
Explainer metadata
The explainer can explain model types:- regression
- binomial
- multinomial
- can-add-feature
- explains-model-debugging
- h2o-sonar
Explainer run
Explainer run details:- Status code: SUCCESS
- Progress: 100%
- Started: 2026-01-30 17:31:21 T+0100
- Duration: 0.86s
Explainer log
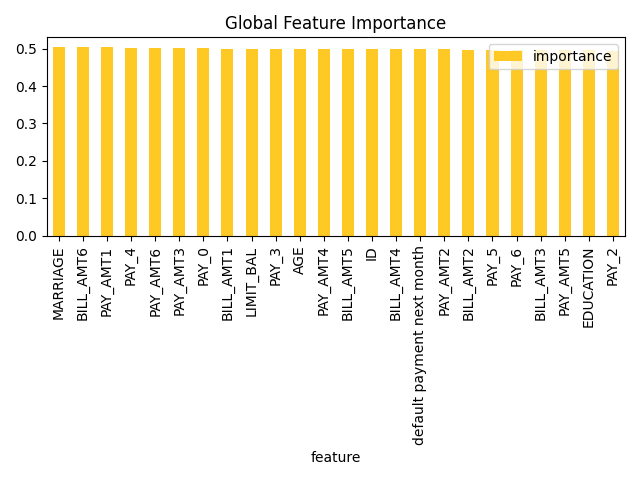
Explainer log file:Explainer: Shapley Values for Original Features (Kernel SHAP Method)
Explainer description
Shapley explanations are a technique with credible theoretical support that presents consistent global and local variable contributions. Local numeric Shapley values are calculated by tracing single rows of data through a trained tree ensemble and aggregating the contribution of each input variable as the row of data moves through the trained ensemble. For regression tasks, Shapley values sum to the prediction of the Driverless AI model. For classification problems, Shapley values sum to the prediction of the Driverless AI model before applying the link function. Global Shapley values are the average of the absolute Shapley values over every row of a dataset. Shapley values for original features are calculated with the Kernel Explainer method, which uses a special weighted linear regression to compute the importance of each feature. More information about Kernel SHAP is available at http://papers.nips.cc/paper/7062-a-unified-approach-to-interpreting-model-predictions.pdf.
Explanations
Feature importance for the class '1':
The most important
original
feature of the class
1
is
MARRIAGE
.
Original feature importances for the class '1':
-
1.
MARRIAGEfeature with importance0.5048248714839003 -
2.
BILL_AMT6feature with importance0.5032058119254781 -
3.
PAY_AMT1feature with importance0.5029552167108501 -
4.
PAY_4feature with importance0.5027351920100945 -
5.
PAY_AMT6feature with importance0.5010883391722856 -
6.
PAY_AMT3feature with importance0.5004985354974225 -
7.
PAY_0feature with importance0.500284473535244 -
8.
BILL_AMT1feature with importance0.5002006452352199 -
9.
LIMIT_BALfeature with importance0.4997530831820978 -
10.
PAY_3feature with importance0.49947839694224516 -
11.
AGEfeature with importance0.4993569130311947 -
12.
PAY_AMT4feature with importance0.49910010407530536 -
13.
BILL_AMT5feature with importance0.4990933644743017 -
14.
IDfeature with importance0.49842250047515246 -
15.
BILL_AMT4feature with importance0.4982346212625947 -
16.
default payment next monthfeature with importance0.497985070650521 -
17.
PAY_AMT2feature with importance0.49785012302559956 -
18.
BILL_AMT2feature with importance0.4974761425230914 -
19.
PAY_5feature with importance0.49722928324889265 -
20.
PAY_6feature with importance0.4971471089510063 -
21.
BILL_AMT3feature with importance0.4969625066178144 -
22.
PAY_AMT5feature with importance0.49647477937225026 -
23.
EDUCATIONfeature with importance0.49621047003623286 -
24.
PAY_2feature with importance0.4932958341860075
Explanations
Model explanations created by the explainer organized by explanation types with its formats (representations) identified by media types :-
Shapley on Original Features (Kernel SHAP Method)
global-feature-importance -
Shapley on Original Features (Kernel SHAP Method)
local-feature-importance -
Shapley on Original Features (Kernel SHAP Method)
global-html-fragment
Explainer parameters
Explainer was run with the following parameters:| Parameter | Value | Description | Type | Default value |
|---|---|---|---|---|
| sample_size |
100000
|
Sample size. |
int
|
100000
|
| sample |
True
|
Sample Kernel Shapley. |
bool
|
True
|
| nsample |
|
Number of times to re-evaluate the model when explaining each prediction with Kernel Explainer. Default is determined internally.'auto' or int. Number of times to re-evaluate the model when explaining each prediction. More samples lead to lower variance estimates of the SHAP values. The 'auto' setting uses nsamples = 2 * X.shape[1] + 2048. This setting is disabled by default and runtime determines the right number internally. |
int
|
|
| L1 |
auto
|
L1 regularization for Kernel Explainer. 'num_features(int)', 'auto' (default for now, but deprecated), 'aic', 'bic', or float. The L1 regularization to use for feature selection (the estimation procedure is based on a debiased lasso). The 'auto' option currently uses aic when less that 20% of the possible sample space is enumerated, otherwise it uses no regularization. The aic and bic options use the AIC and BIC rules for regularization. Using 'num_features(int)' selects a fix number of top features. Passing a float directly sets the alpha parameter of the sklearn.linear_model.Lasso model used for feature selection. |
str
|
auto
|
| max runtime |
900
|
Max runtime for Kernel explainer in seconds. |
int
|
900
|
| fast_approx |
True
|
Speed up predictions with fast predictions approximation. |
bool
|
True
|
| leakage_warning_threshold |
0.95
|
The threshold above which to report a potentially detected feature importance leak problem. |
float
|
0.95
|
Explainer metadata
The explainer can explain model types:- regression
- binomial
- multinomial
- explains-original-feature-importance
- is_slow
- h2o-sonar
Explainer run
Explainer run details:- Status code: SUCCESS
- Progress: 100%
- Started: 2026-01-30 17:31:22 T+0100
- Duration: 1.684s
Explainer log
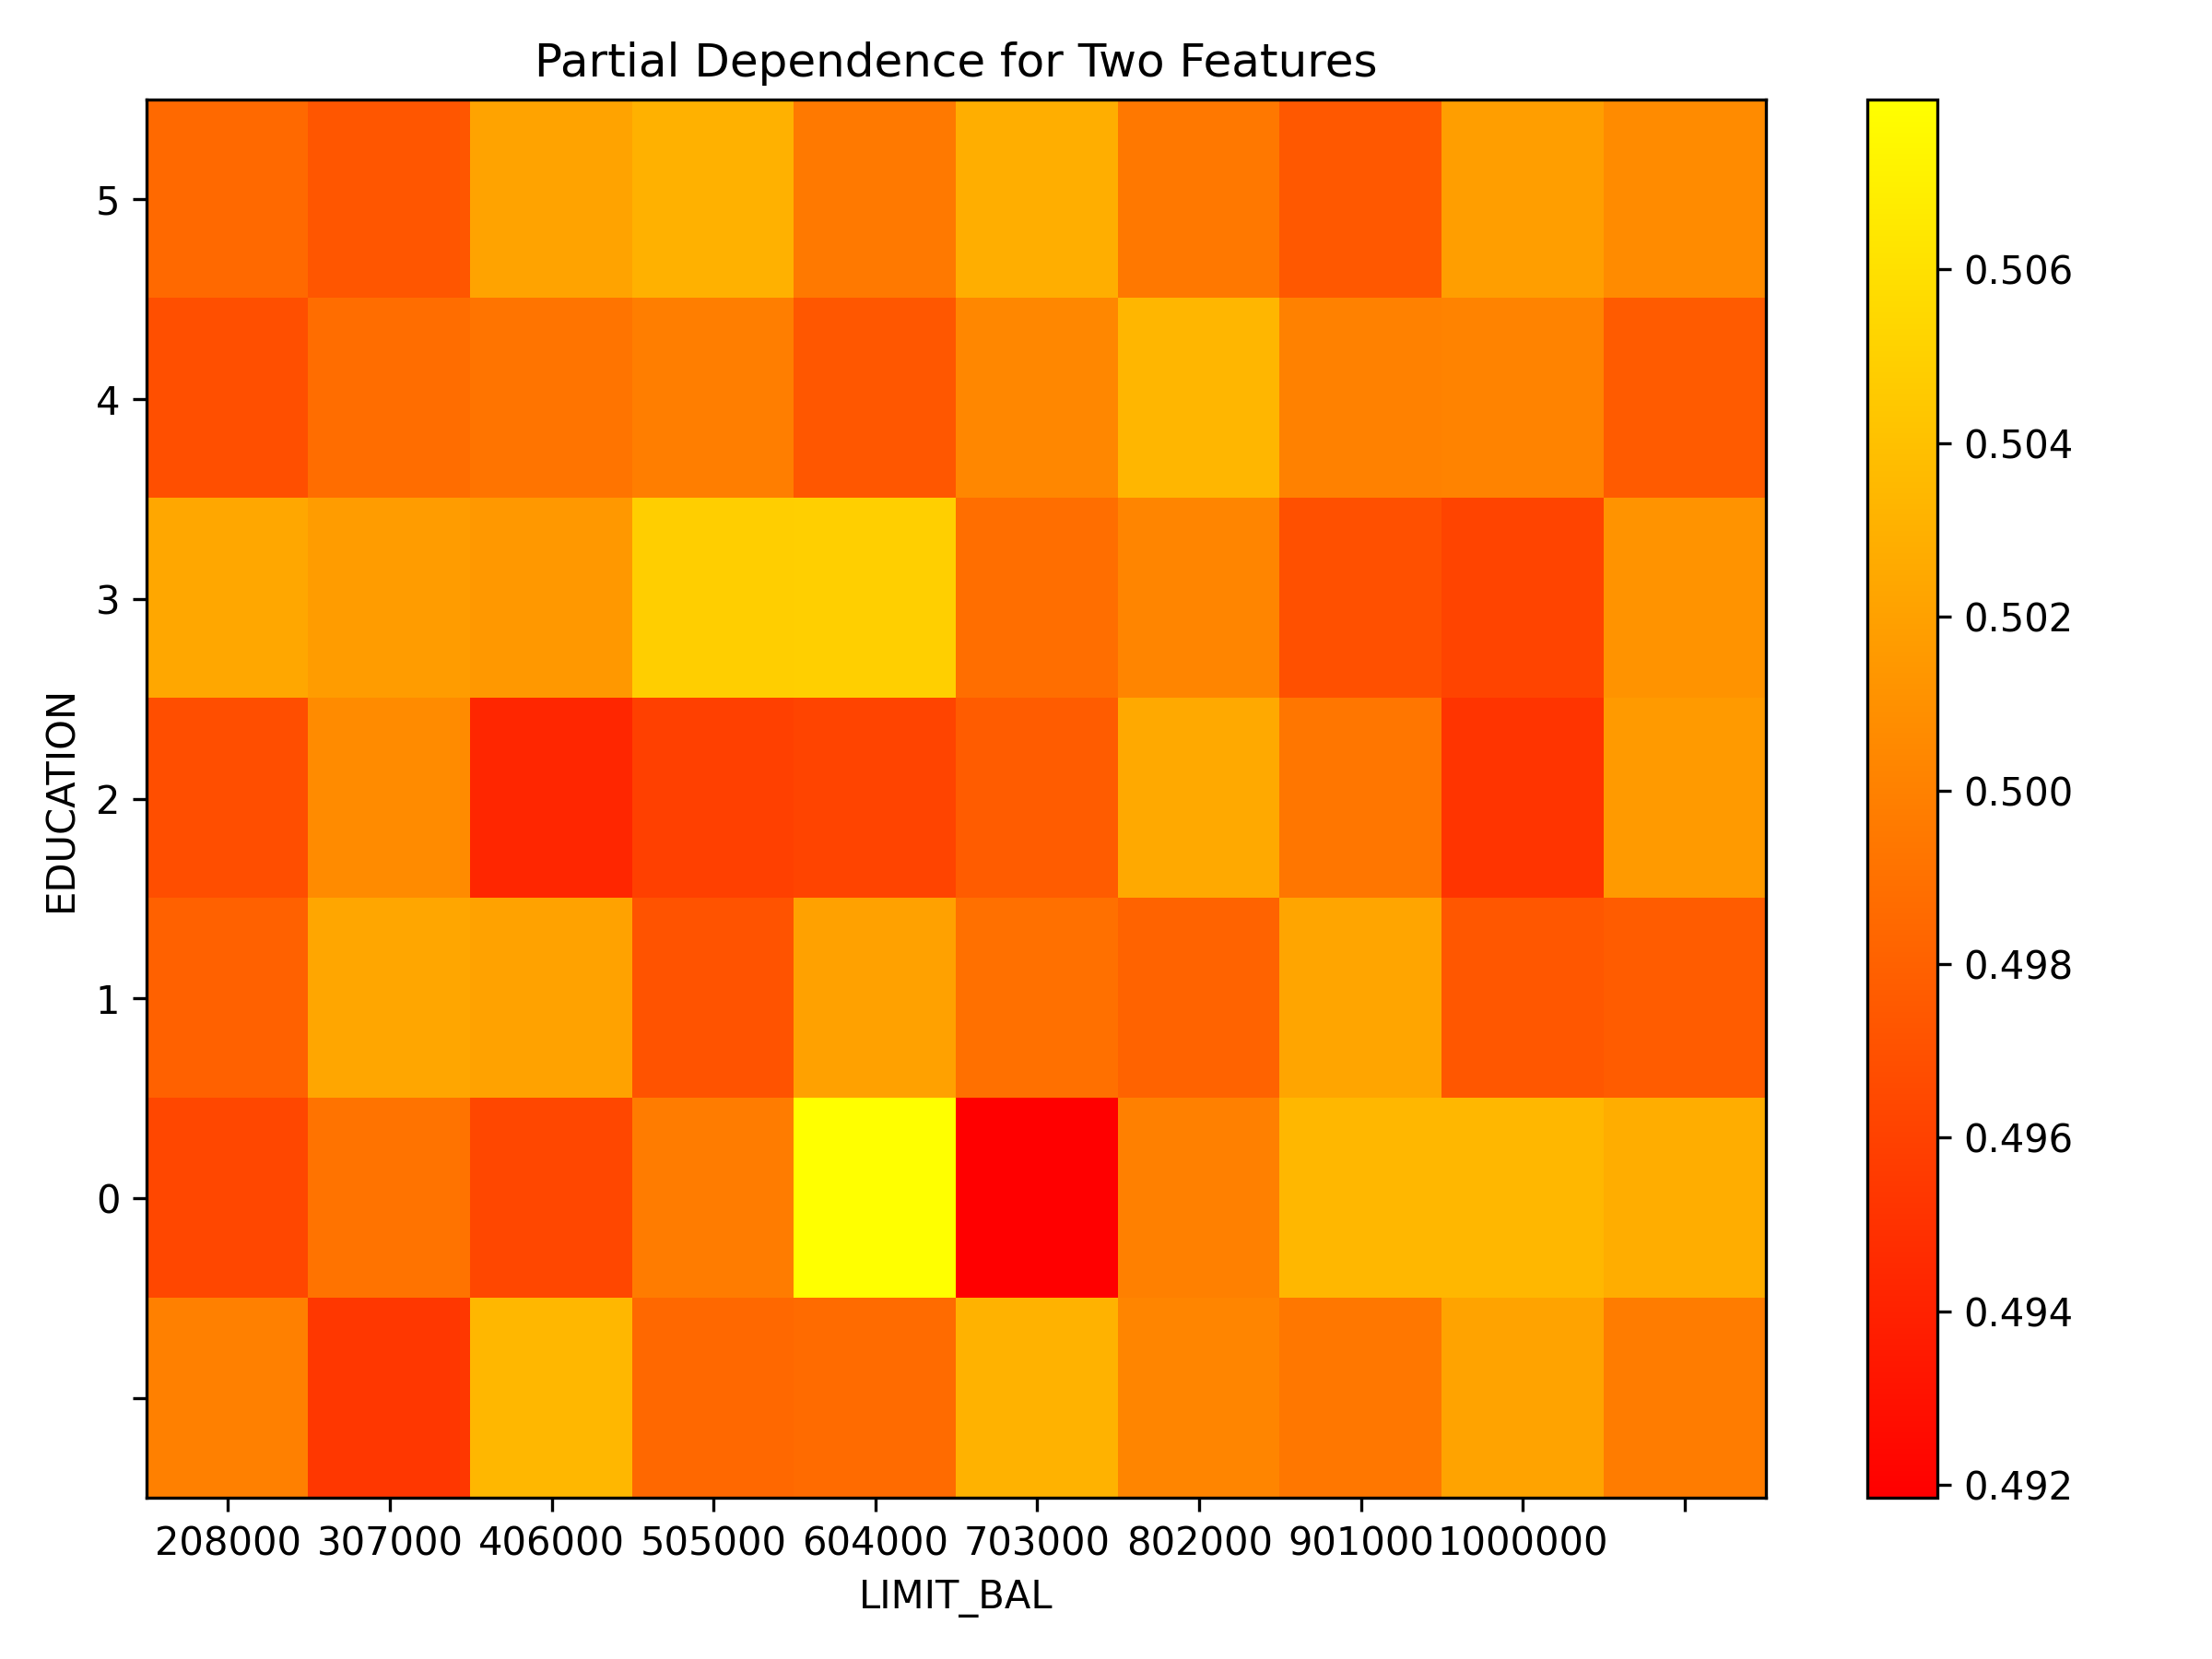
Explainer log file:Explainer: Partial Dependence Plot for Two Features
Explainer description
Partial dependence for 2 features portrays the average prediction behavior of a model across the domains of two input variables i.e. interaction of feature tuples with the prediction. While PD for one feature produces 2D plot, PD for two features produces 3D plots. This explainer plots PD for two features using heatmap, contour 3D or surface 3D.
Explanations
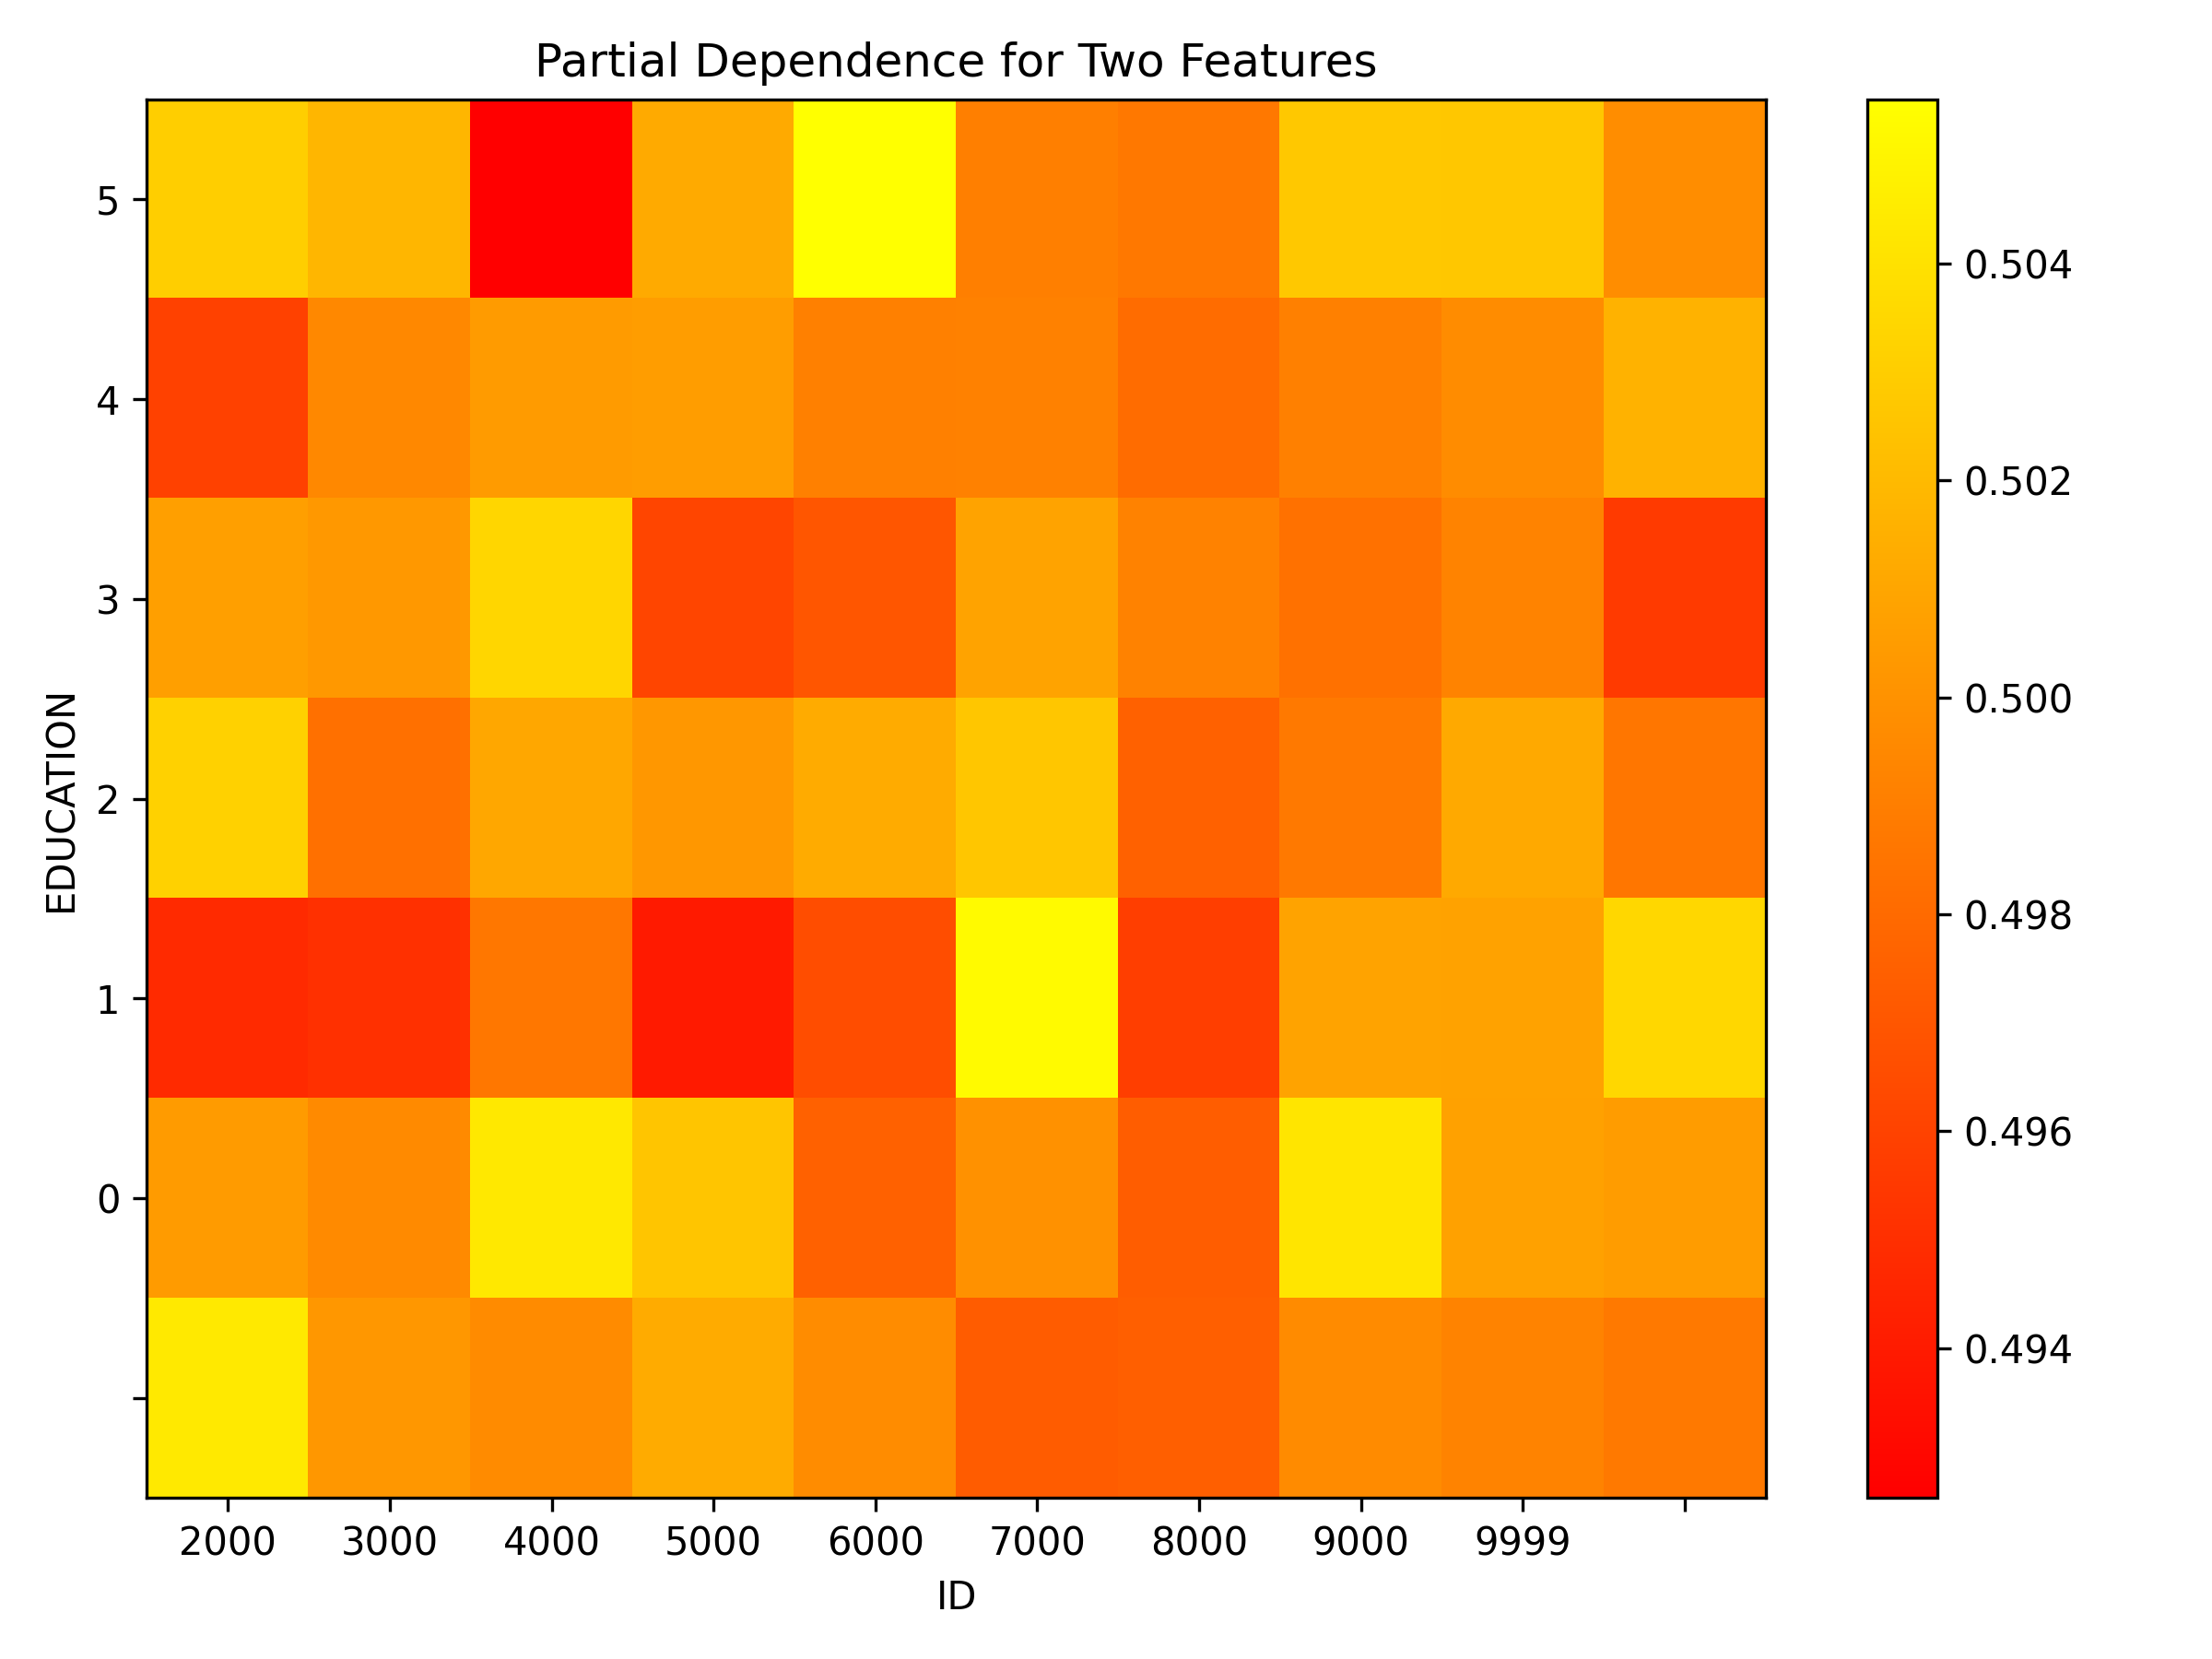
Partial dependence plot for features 'ID' and 'LIMIT_BAL':
Explanations
Model explanations created by the explainer organized by explanation types with its formats (representations) identified by media types :-
Partial Dependence Plot for Two Features
global-report -
Partial Dependence Plot for Two Features
global-3d-data -
Partial Dependence Plot for Two Features
global-html-fragment
Explainer parameters
Explainer was run with the following parameters:| Parameter | Value | Description | Type | Default value |
|---|---|---|---|---|
| sample_size |
25000
|
Sample size for Partial Dependence Plot of 2 features. |
int
|
25000
|
| max_features |
3
|
Partial Dependence Plot number of features. |
int
|
3
|
| features |
None
|
List of features from which to choose pairs to compute PD for two features. |
list
|
None
|
| grid_resolution |
10
|
Partial Dependence Plot observations per bin (number of equally spaced points used to create bins). |
int
|
10
|
| oor_grid_resolution |
0
|
Partial Dependence Plot number of out of range bins. |
int
|
0
|
| quantile-bin-grid-resolution |
0
|
Partial Dependence Plot quantile binning (total quantile points used to create bins). |
int
|
0
|
| plot_type |
heatmap
|
Plot type. |
str
|
heatmap
|
Explainer metadata
The explainer can explain model types:- regression
- binomial
- is_slow
Explainer run
Explainer run details:- Status code: SUCCESS
- Progress: 100%
- Started: 2026-01-30 17:31:24 T+0100
- Duration: 2.225s
Explainer log
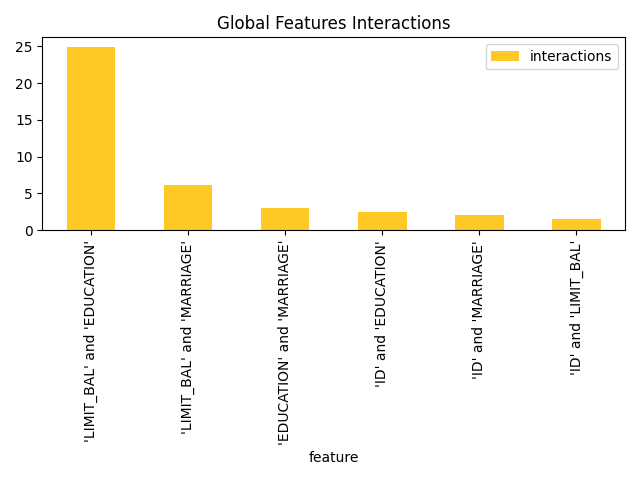
Explainer log file:Explainer: Friedman's H-statistic
Explainer description
Friedman's H-statistic describes the amount of variance explained by the feature pair. It's expressed with a graph where most important original features are nodes and the interaction scores are edges. When features interact with each other, then the influence of the features on the prediction does not have be additive, but more complex. For instance the contribution might be greater than the sum of contributions. Friedman's H-statistic calculation is computationally intensive and typically requires long time to finish - calculation duration grows with the number of features and bins.
Explanations
Feature importance for the class 'None (Regression)':
Explanations
Model explanations created by the explainer organized by explanation types with its formats (representations) identified by media types :-
Friedman's H-statistic report
global-report -
Friedman's H-statistic
global-feature-importance -
Friedman's H-statistic
global-html-fragment
Explainer parameters
Explainer was run with the following parameters:| Parameter | Value | Description | Type | Default value |
|---|---|---|---|---|
| features_number |
4
|
Number of features for which to calculate H-Statistic. |
int
|
4
|
| grid_resolution |
3
|
Observations per bin (number of equally spaced points used to create bins). |
int
|
3
|
| features |
None
|
Feature list - at least 2 features must be selected. |
multilist
|
None
|
| sample_size |
25000
|
Sample size for Partial Dependence Plot |
int
|
25000
|
Explainer metadata
The explainer can explain model types:- regression
- binomial
- explains-feature-behavior
- h2o-sonar
- is_slow
Explainer run
Explainer run details:- Status code: SUCCESS
- Progress: 100%
- Started: 2026-01-30 17:31:26 T+0100
- Duration: 0.486s
Explainer log
Explainer log file:Explainer: Dataset and model insights explainer
Explainer description
The explainer checks the dataset and model for various issues. For example, it provides problems and actions for missing values in the target column and a low number of unique values across columns of a dataset.
Explanations
Explanations
Model explanations created by the explainer organized by explanation types with its formats (representations) identified by media types :-
Dataset and model insights explainer
global-text-explanation
Explainer parameters
Explainer was run with the following parameters:Explainer metadata
The explainer can explain model types:- regression
- binomial
- multinomial
Explainer run
Explainer run details:- Status code: SUCCESS
- Progress: 100%
- Started: 2026-01-30 17:31:27 T+0100
- Duration: 0.212s
Explainer log
Explainer log file:Dataset
Dataset description:-
Dataset
=
<class 'datatable.Frame'> -
Dataset file path
=
data/predictive/creditcard.csv- Path to the dataset.
-
Dataset size
=
944719B- Size of the dataset.
- Dataset data frame type.
-
Dataset frame shape
=
(10000, 25)- Dataset data frame shape.
-
Row count
=
10000- The number of the dataset rows.
-
Column names
=
['ID', 'LIMIT_BAL', 'SEX', 'EDUCATION', 'MARRIAGE', 'AGE', 'PAY_0', 'PAY_2', 'PAY_3', 'PAY_4', 'PAY_5', 'PAY_6', 'BILL_AMT1', 'BILL_AMT2', 'BILL_AMT3', 'BILL_AMT4', 'BILL_AMT5', 'BILL_AMT6', 'PAY_AMT1', 'PAY_AMT2', 'PAY_AMT3', 'PAY_AMT4', 'PAY_AMT5', 'PAY_AMT6', 'default payment next month']- Dataset column names.
-
Unique values
=
[10000, 72, 2, 7, 4, 54, 11, 11, 11, 11, 10, 10, 8371, 8215, 8072, 7913, 7764, 7550, 3763, 3581, 3305, 3247, 3258, 3174, 2]- The number of unique values for dataset columns.
-
Column types
=
['int', 'int', 'int', 'int', 'int', 'int', 'int', 'int', 'int', 'int', 'int', 'int', 'int', 'int', 'int', 'int', 'int', 'int', 'int', 'int', 'int', 'int', 'int', 'int', 'bool']- Dataset column types.
-
Dataset columns:
-
ID-
Data type
=
int -
ID column
=
True -
Numeric column
=
True -
Count
=
10000 -
Unique
=
10000
-
Data type
=
-
LIMIT_BAL-
Data type
=
int -
Numeric column
=
True -
Count
=
72 -
Unique
=
72
-
Data type
=
-
SEX-
Data type
=
int -
Numeric column
=
True -
Count
=
2 -
Unique
=
2
-
Data type
=
-
EDUCATION-
Data type
=
int -
Numeric column
=
True -
Count
=
7 -
Unique
=
7
-
Data type
=
-
MARRIAGE-
Data type
=
int -
Numeric column
=
True -
Count
=
4 -
Unique
=
4
-
Data type
=
-
AGE-
Data type
=
int -
Numeric column
=
True -
Count
=
54 -
Unique
=
54
-
Data type
=
-
PAY_0-
Data type
=
int -
Numeric column
=
True -
Count
=
11 -
Unique
=
11
-
Data type
=
-
PAY_2-
Data type
=
int -
Numeric column
=
True -
Count
=
11 -
Unique
=
11
-
Data type
=
-
PAY_3-
Data type
=
int -
Numeric column
=
True -
Count
=
11 -
Unique
=
11
-
Data type
=
-
PAY_4-
Data type
=
int -
Numeric column
=
True -
Count
=
11 -
Unique
=
11
-
Data type
=
-
PAY_5-
Data type
=
int -
Numeric column
=
True -
Count
=
10 -
Unique
=
10
-
Data type
=
-
PAY_6-
Data type
=
int -
Numeric column
=
True -
Count
=
10 -
Unique
=
10
-
Data type
=
-
BILL_AMT1-
Data type
=
int -
Numeric column
=
True -
Count
=
8371 -
Unique
=
8371
-
Data type
=
-
BILL_AMT2-
Data type
=
int -
Numeric column
=
True -
Count
=
8215 -
Unique
=
8215
-
Data type
=
-
BILL_AMT3-
Data type
=
int -
Numeric column
=
True -
Count
=
8072 -
Unique
=
8072
-
Data type
=
-
BILL_AMT4-
Data type
=
int -
Numeric column
=
True -
Count
=
7913 -
Unique
=
7913
-
Data type
=
-
BILL_AMT5-
Data type
=
int -
Numeric column
=
True -
Count
=
7764 -
Unique
=
7764
-
Data type
=
-
BILL_AMT6-
Data type
=
int -
Numeric column
=
True -
Count
=
7550 -
Unique
=
7550
-
Data type
=
-
PAY_AMT1-
Data type
=
int -
Numeric column
=
True -
Count
=
3763 -
Unique
=
3763
-
Data type
=
-
PAY_AMT2-
Data type
=
int -
Numeric column
=
True -
Count
=
3581 -
Unique
=
3581
-
Data type
=
-
PAY_AMT3-
Data type
=
int -
Numeric column
=
True -
Count
=
3305 -
Unique
=
3305
-
Data type
=
-
PAY_AMT4-
Data type
=
int -
Numeric column
=
True -
Count
=
3247 -
Unique
=
3247
-
Data type
=
-
PAY_AMT5-
Data type
=
int -
Numeric column
=
True -
Count
=
3258 -
Unique
=
3258
-
Data type
=
-
PAY_AMT6-
Data type
=
int -
Numeric column
=
True -
Count
=
3174 -
Unique
=
3174
-
Data type
=
-
default payment next month-
Data type
=
bool -
Categorical column
=
True -
Count
=
2 -
Unique
=
2
-
Data type
=
- Dataset columns metadata.
-
Model
Model description:-
Model type
=
mock- Model type.
-
Experiment type
=
binomial- Experiment type.
-
Target column
=
SEX- Target column.
-
Labels count
=
1- The number of interpreted model labels.
-
Labels
=
[1]- Interpret model labels.
-
Used features
=
['ID', 'LIMIT_BAL', 'EDUCATION', 'MARRIAGE', 'AGE', 'PAY_0', 'PAY_2', 'PAY_3', 'PAY_4', 'PAY_5', 'PAY_6', 'BILL_AMT1', 'BILL_AMT2', 'BILL_AMT3', 'BILL_AMT4', 'BILL_AMT5', 'BILL_AMT6', 'PAY_AMT1', 'PAY_AMT2', 'PAY_AMT3', 'PAY_AMT4', 'PAY_AMT5', 'PAY_AMT6', 'default payment next month']- Features (dataset columns) used by the interpreted model.
-
Transformed features
=
[]- Transformed features created by/used by the interpreted model.
Configuration and parameters
Interpretation parameters:
-
model =
<class 'tests.lib.test_containers.SimpleMockModel'>- Interpreted model.
-
Type:
any -
Default value:
-
models =
None- Evaluated LLM/RAG models.
-
Type:
any -
Default value:
-
dataset =
data/predictive/creditcard.csv- Dataset used to interpret the model.
-
Type:
any -
Default value:
-
validset =
None- Optional validation dataset used to interpret the model.
-
Type:
str -
Default value:
-
testset =
None- Optional test dataset used to interpret the model.
-
Type:
str -
Default value:
-
use_raw_features =
True- Whether to use original features for the training of Surrogate model explainers (True, default) or force transformed features (False).
-
Type:
bool -
Default value:
-
target_col =
SEX- Target column of the interpreted model.
-
Type:
str -
Default value:
-
weight_col =
- Optional name of the dataset column with weights of examples to be used in the model interpretation.
-
Type:
str -
Default value:
-
prediction_col =
- Optional name of the dataset column with predictions of examples to be used in the (standalone ~ no model, just predictions) model interpretation.
-
Type:
str -
Default value:
-
drop_cols =
[]- Optional list of the dataset column names to be drop and not used in the model interpretation.
-
Type:
list -
Default value:
[]
-
sample_num_rows =
0- The sample size, number of rows, to be used for the surrogate models. This setting overrides global library sampling configuration.
-
Type:
int -
Default value:
0
-
results_location =
/tmp/pytest-of-dvorka/pytest-35/test_all_explainers0- Filesystem path (database connectio or other storage type location) which specifies where to store interpretation results. Current directory is used by default
-
Type:
str -
Default value:
-
used_features =
None- Optional specification of the features (dataset columns) used by the interpreted model (in case that model doesn's support used features introspection).
-
Type:
list -
Default value:
None
| Config parameter | Value | Description | Type | Default value |
|---|---|---|---|---|
| h2o_host |
localhost
|
The host of the H2O-3 server that should be used for the explanation that requires it. |
str
|
localhost
|
| h2o_port |
54321
|
The port of the H2O-3 server that should be used for the explanation that requires it. |
int
|
12349
|
| h2o_auto_start |
False
|
Automatically start H2O-3 server on the interpretation start (True), or do not start the server (False). |
bool
|
True
|
| h2o_auto_cleanup |
True
|
Automatically remove all data from the H2O-3 server onthe interpretation end (True), or do not remove all data fromthe server (False). |
bool
|
True
|
| h2o_auto_stop |
False
|
Automatically stop H2O-3 server on the interpretation end (True), or do not stop the server (False). |
bool
|
False
|
| h2o_min_mem_size |
2G
|
Minimum memory specification for H2O-3 server started by H2O Sonar. |
int
|
2G
|
| h2o_max_mem_size |
4G
|
Maximum memory specification for H2O-3 server started by H2O Sonar. |
int
|
4G
|
| custom_explainers |
[]
|
List of custom "Bring Your Own Explainer" string locators to be registered on H2O Sonar run. The location has the following structure: "[PACKAGE and MODULE]::[EXPLAINER-CLASS-NAME]" where PACKAGE and MODULE is dot (.) separated path to the the module (installed on PYTHONPATH) and EXPLAINER-CLASS-NAME is the name of explainer class. Example: [ "my_package.explainer_module::MyExplainerClass", "their_package.explainer_module::TheirExplainerClass"] |
customlist
|
[]
|
| look_and_feel |
h2o_sonar
|
Charts theme (look and feel) - one of: 'h2o_sonar', 'blue', 'driverless_ai'. |
str
|
h2o_sonar
|
| device |
cpu
|
Device to be used for the calculations. The value of this configuration item might be ``cpu`` or ``gpu``. |
str
|
|
| enable_slow_perturbators |
False
|
Enable slow (agent-based, model-based, resource intensive) perturbators which are by default skipped and not listed. |
bool
|
False
|
| force_eval_judge |
false
|
Force the use of custom evaluation judge for the evaluation of the models over the judges used by evaluators by default. For example to use a local judge in order to avoid sending sensitive data to a 3rd party or to the cloud. The value of this configuration item might be ``false``, ``true`` or configuration key of the custom evaluation judge. Forcing the use of a custom evaluation judge will automatically reconfigure the embeddings calculation in evaluations to a local model to ensure privacy safety. |
str
|
false
|
| multiprocessing_start_method |
spawn
|
Multiprocessing start method - one of: 'spawn', 'fork', 'forkserver' or `None` (default). |
str
|
spawn
|
| model_cache_dir |
/home/dvorka/.cache/h2o_sonar/models
|
Directory where the models are cached. If not specified, the models are cached in a default directory in user home which follows operating system conventions. |
str
|
/home/dvorka/.cache/h2o_sonar/models
|
| http_ssl_cert_verify |
True
|
SSL certificate verification for HTTPS requests. If set to ``false``, then SSL certificate verification is disabled. If set to ``true``, then SSL certificate verification is enabled. If set to the path (string) to a ``CA_BUNDLE`` file or directory with certificates of trusted CAs, then they will be used for the verification (in this case the directory must have been processed using the c_rehash utility supplied with OpenSSL). |
str
|
true
|
| branding |
|
Branding for HTML reports. If not specified (empty string). Valid values: 'H2O_SONAR', 'EVAL_STUDIO', or '' (empty for auto). |
str
|
|
| per_explainer_logger |
True
|
Create new logger for each explainer (which logs to explainer sandbox) or reuse one logger and use library logger for all log messages. |
bool
|
True
|
| create_html_representations |
True
|
Indicate that explainers can create HTML representation (True), or request to skip it (False) from performance/resource consumption reasons. |
bool
|
True
|
| connections |
[]
|
|
|
|
| licenses |
[]
|
|
|
|
| evaluation_judges |
[]
|
|
|
Directories, files and logs
Directories and files: